Automated Water Quality Monitoring System
Team
- E/15/077, K.P.W.A.K.K. Dilhani, kshithija.dilhani@gmail.com
- E/15/279, L.S.W.S. Premathilaka, wathsaripremathilaka@gmail.com
- E/15/211, S.A.I. Maduwanthi, ishmadhuwanthi@gmail.com
Table of Contents
Introduction
Fresh water is finite resource need for agriculture,industry and human existence. Therefore the quality of water is very important.The objective of this project is to develop automated water quality monitoring system by using continues measurements of pH and turbidity measurement.Normal process is water samples are normally collected at regular period and do the analysis and this ask for larger time consumption.But in this project we hope to offer fast and easy monitoring of pH and turbidity levels with IoT applications for continues maintenance of clean water.
The process carried out water treatment plant.

Solution Architecture

Hardware and Software Designs
Circuit Diagram

Flow Chart

Front-End Technologies

UI Design

Back-End Technologies

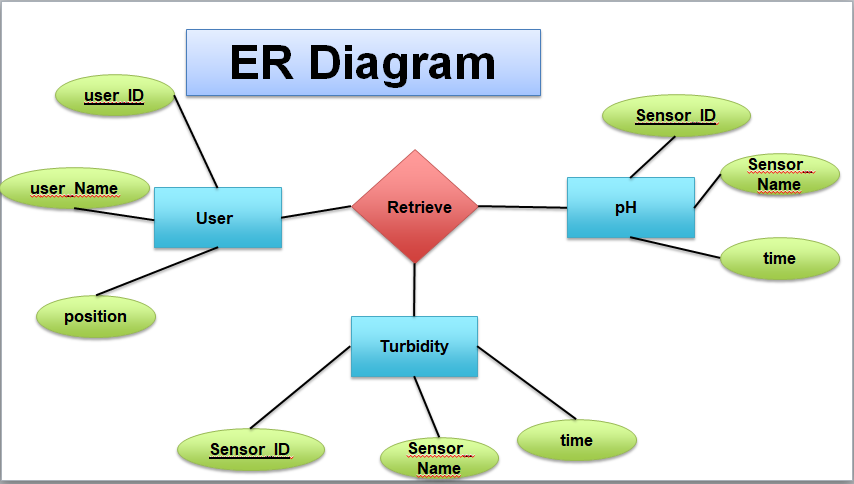
ER Diagran

Testing
Test Plan
Following are the test plan that is to be tested.
Integration Testing Focus – pH sensor, web site Inputs and expected output are like below.
PH <6.5 –> Alert
PH 6.5 – 7. 5 –> Normal
PH >7.5 –> Alert
Assumption – temperature 25(C)
Testing Environment – wifi connection,pH sensor along with the embedded device and web interface Testing Process - In our system we are designing it to give alert when the variation of pH and turbidity values occurred. We can give some sort of boundary values to the system and check whether it gives expected output to the clients. Normally pH value of treated water should be in the range of 6.5 – 7.5.Then we are going to test our system using this case. By using soap water ,normal water and leman water it can be tested.
Unit Testing
Test whether sensors are working properly.Test both pH and Turbidity sensors with known solutions to verify whether it gives expected values. Focus – pH sensor Inputs and expected outputs –pH value of water is going to be changed by using pH known chemical and expecting their exact pH values using our pH sensor
    2.2 – Vinegar
    10.5 - Milk of Magnesia
    14.0 - Sodium Hydroxide (NaOH)
Assumption – temperature 25(C) Testing Environment – pH sensor is needed
Load Testing Focus –whole system Inputs – increase the number of nodes up to 30 nodes for the system using
dummy values Expected output –system should operate properly as before Assumption - temperature 25(C) Testing Environment – pH sensor ,Turbidy sensors,wifi connection and web site
Conclusion
Now we have completed two nodes in the system. We can measure pH values and Turbidity values in real time of those two water treatment stages. But we still doing it in using two water samples(pure water and muddy water). And the Database also updating at the same time when sensor values are updated. And when considering the web application, the data can be retrieved easily. And tables in the web application also real-time updated with the database.
