
Project Title
Data Mining System for Selecting a Winning Cricket Team
Team
- E/15/119, Dinithi Hasanika, dinithiliyanage.95@gmail.com
- E/15/202, Dulanjali Liyanage, preethi.du1995@gmail.com
- E/15/208, Roshani Dilhara, roshanidilhara7@gmail.com
Supervisors
- Dr. Asitha Bandaranayake, asithab@eng.pdn.ac.lk
- Sampath Deegalla, sampath@eng.pdn.ac.lk
Table of content
- Abstract
- Related works
- Methodology
- Experiment Setup and Implementation
- Results and Analysis
- Conclusion
- Links
Abstract
Cricket is a two-team game which was originated in south-east England and developed globally in the 19th century. This world’s second most popular game is played for a limited number of overs as twenty20 for twenty overs and ODI(One Day International) matches for 50 overs. Test matches are played for five days. Due to the availability of ball-by-ball data of this bat-and-ball game, researchers were able to do statistical analysis of data for pattern recognition, to find factors affecting the game and for outcome prediction of a match. But due to the high uncertainty of the game, it has become very difficult to come up with a stable and accurate model for the predictions. Outcome model also depends on the number of overs, match type, considering time period and players combination. This research focus only the ODI matches and considering only the ICC full members; England, Australia, New Zealand, Sri Lanka, Bangladesh, Pakistan, India, Zimbabwe, West Indies, Afghanistan, South Africa and Ireland. This outcome prediction is based on players performances in a team and some features specific to the team and the match. The individual performance of batsmen, bowlers and fielders are analysed separately considering all-time ODI data. Combined performance of batsmen and bowlers were analysed and compared with individual performances using statistical method. Association rule mining method was used to find frequent winning player combinations. Match data from 2015 to 2020 were considered for the combined performance analysis and outcome prediction. For all these predictions we use data mining and machine learning techniques.
Related works
1. Player Performance
Each cricket team is a combination of batsmen, bowlers, fielders, and all-rounders including the wicket-keeper. For the winnability of the team, individual batsmen should score maximum runs, individual bowlers should take the maximum wickets possible while restricting the opponent team from scoring either by runs or offering extras. For the victory, the wicket keeper should also contribute as a batsman, other than playing behind the wickets. All-rounders contribute by scoring runs and taking wickets since they have the ability of both batting and bowling. Fielders should contribute to the team by getting the batsmen out of the game or by limiting the scoring of batsmen.
Individual players’ performance has a significant impact on the winnability of a cricket team. So, the accurate metrics that affect the winnability of a specific team should be found to evaluate the individual players. The basis of modeling the strength of a team is enhancing the strength of batting and bowling of individual players. Many researchers have analyzed different methods for this player performance evaluation, and the below sections will go through them.
2. All-Rounder Performance
The players who show talents in both batting and bowling are called all-rounders in a match. This also can be categorized into two as bowl all-rounders who are more skilled for bowling than batting and batting all-rounders who are more skilled for batting than bowling. It is better to have at least one all-rounder for one team.
3. Player Ranking and Player Order
Cricket player ranking is an important point when directing a match towards winning. Since batting order and bowling order matters in winning. Open batsmen and bowlers who bowl the maiden overs and last overs are also considered as important factors that can be influenced to the final outcome of the match. Open batsmen do not need to be the best players but need to be the experienced players in open batting. From positions, 3 to 6 should consist of the best batsmen from better to poor. Most of the time 7th position is for the wicket keeper. Positions 8 to 11 for bowlers.
P. Premkumar et al. came up with a model to rank batsman and bowlers according to their performance in ODI matches. They considered runs scored by a batsman on a match-by-match basis and took the average for the considered time duration. They considered wickets taken by a bowler when ranking bowlers. Other than that they considered location impact, pitch impact, Batting innings impact, Opposition impact, team impact, and strike rate impact when ranking both the batsmen and bowlers.
V. Kanungo et al. visualized data of best-performed players in IPL. They ranked players considering four factors; the number of man of the matches, number of centuries recorded batsmen with top strike rates, top 10 players with maximum total runs.
T. B. Swartz et al. developed a model for the Indian team to find optimal or nearly optimal batting orders to play in ODI matches. It used a simulated annealing approach and developed an algorithm to select the optimal batting team. They considered features like batsmen, the number of wickets lost, the number of balls bowled, the bowler, the opposing team, and the condition of the pitch. This method suggested some batting orders that have never been tried by the Indian team.
J. M. Norman et al. came up with two models to find the optimal batting order for the Australian team. Model 1 is for limited-overs matches and Model 2 is for unlimited overs matches. They categorized player positions 1 to 3 as the top, 4 to 6 as good, 7 to 9 as average, and 10 to 11 as slogger. When grouping Australian players to the above-mentioned categories, they considered average runs, run rate, and dismissal probability. They built a model to decide when there is a sudden dismissal. They found that it is more advantageous than having a fixed batting order.
Harsha Perera et al. built up an algorithm using simulated annealing to determine the optimal player for the Twenty20 matches. They created models for India and South Africa. And this model selects two separate player orders as the optimal batting order and optimal bowling order.
4. Team Performance
Cricket is played by 2 teams against each other. A team consists of 11 players. But it is not a fixed team. Players in a team can be changed over time and also team may change match by match. In that case, it is important to consider the influence of team performance in the final outcome of a match. The performance of a team is mainly based on each individual player’s performance and some other factors. Researchers have attempted to include evaluations of team performance in predicting the outcome of a cricket match. So the following sections discuss the various methods used by past researches to evaluate team performance.
5. Team Performance metrics and overall performance
Better performance of a team is mainly affected by each individual player’s performance in it. These factors impact on predicting the outcome of the match. Madan Gopal Jhawar et al. has addressed this situation in their research using ODI match results. They have suggested that the relative team strength is a distinctive feature in predicting the outcome of a cricket match. Since a team can be changed due to various reasons, they have suggested a parameter to express the team performance. That is the relative strength of a team. Means strength of team A against team B. To calculate this they have used two factors as batting and bowling to model each individual player. Then depending on related factors, they have given a score for each of them. Since these scores have different ranges they have been normalized to lie in the same range. Then the batting strength of a team is calculated as the summation of batting scores of all the players in the team. The bowling strength of a team is calculated as the summation of bowling scores of all the players in the team. Depending on these scores, the strength of team A against team B is calculated. Where A and B are the two opposing teams playing the match. This calculation is used as one of the attributes to predict the outcome of the match.
N. Siva et al. has proposed a method to evaluate a team based on their past data, without considering its players. In this evaluation, they have considered 556 matches played from 2006 to 2017. The analysis has been done only on the Sri Lankan cricket team. To evaluate the team performance they have considered ten attributes with categorical values. Those attributes are city, venue, match type, outcomes, number of overs, player of the match, opposition, toss winner, toss decision, and winner. Using these attributes they have come up with a classification based model to predict the outcome of a match. They have used machine learning algorithms in predicting the outcome of a match using the overall performance of a team.
N. Pathak et al. has used the factors analyzed by A. Bandulasiri in creating a model for each team to predict the outcome of an ODI cricket match from the time duration of 2001 to 2015. Those factors are Toss outcome, Day/Night effect, Home game advantage, and bat first. In this analysis, they have not considered individual player performance. The Naïve Bayesian classification technique has shown the best results.
A. C. Kaluarachchi et al. have selected the attributes team, opponent team, home/away, day/night, toss, bat first and result to predict the outcome of an ODI cricket match. They have considered all the ODI matches from 1971 up to 2010. The outcome was displayed through a software tool called CricAI. Since Bayesian classifiers have shown the best results, it has been used in this tool. This analysis also has not considered the impact of individual player performance on the team performances.
M. Bailey et al. has considered the factors home ground advantage, past performance, match experience, performance at a specific venue, performance against a specific opposition, experience at the specific venue, and current form, in predicting the ODI match outcome while the match is in progress. They have considered 2200 ODI matches prior to 2005. Using these results they have created models to predict Margin of Victory(MOV) and the team totals. For the prediction of team totals, only 100 ODI matches of 2015 have been used. For the rain-interrupted matches DL method has been used in predicting the team total. Team totals are compared using AAE(Absolute Average Error) between the actual and predicted values. Results are obtained as totals for the team batting first and totals for the team batting second. From that first innings, totals were more accurate and the second innings totals predictions were more accurate as the game reached the end.
B. Morley et al. has focused on the team’s decision on whether to bat first or second considering factors of home-field effect and winning the toss. They have considered only the English ODI match data during the period 1996 to 1997 league season. 57\% of matches have been won by the home team and 51\% of matches have been won by the team winning the toss. 56\% of matches have been won by the home team where they have won the toss and chooses the batting order. Only 43\% of matches have been won by the away team where they won the toss and decide the batting order. Therefore this suggests that winning the toss and deciding the batting order is of great advantage for the home team. But the effect of winning the toss can be nullified by adding the team quality and match importance and these factors are more important in predicting the outcome of a match.
S. A. D. P. Subasingha et al. has proposed a novel method in predicting the outcome of an ODI cricket match. They have used two sub-data models in predicting the outcome of the match. One model is used in predicting the outcome of a match, based on pre-match data. And the other model is used in predicting the outcome of the match using the batting partnership of both teams. The first model is team-based. They have considered the attributes toss effect, ground condition, day/night effect, and opponent in the first model. A Naïve Bayes algorithm has been used to predict the final outcome. A statistical analysis has been proposed by A. Nimmagadda et al. predicted the result of a Twenty20 match while in progress. In this analysis they have not considered the number of wickets fallen, venue of the match, and the toss at the first phase. Instead of that their prediction of scores for a team was based on runs scored, and looking at different totals at the end of innings and various run rates. But since considering only run rates did not give good results, they also have estimated the batting and bowling potentials of 22 players using their career statics and active participation in recent games. These player potentials have been used to get the relative dominance one team has over the other. Prediction modeled using Multiple linear regression and has included the batsman increase, bowler, wickets, and run rates as attributes.
K. Kapadia et al. have used IPL match data to come up with a machine learning model to predict the result of a match, based on historical match data. Based on features related to home ground and toss decision of team, two sets of different models have been obtained. Naïve Bayes has shown 57\% accuracy and 60.5\% precision and Model Trees has a 68.6\% recall rate, when the home team is the winner of the match when considering only the home team feature sets. kNN model has shown 62\% accuracy, 64.2\% precision, 58.4\% recall rate when the toss winning team is the winner of the match when considering only the toss winner feature set.
P. Somaskandhan et al. has considered IPL matches from 2008 to 2016, 350 matches and 700 innings included to their consideration. They have considered 23 features like total runs scored in an innings, the total number of wickets in an innings, highest individual score in an innings, runs in the power-play of the innings which affect on the team performance of a IPL match.They used feature selection techniques in machine learning to identify the best set of features which impose significant impact on the end results of the match.
P.A. Gregory et al. have chosen the IPL match details as their domain since it provided them with a satisfactory amount of data for their analysis in predicting the outcome of a match based on a specific feature set. Their data set was comprised of 501 instances of IPL matches and have used relational mapping framework to store data in a database. Their main component of the analysis was the feature set which includes 14 different features. Namely Number of Wickets Lost, Four Hitting Frequency, Six Hitting Frequency, Boundary Run Percentage, Dot Ball Percentage, Dot Ball to Runs Ratio, Run Rate, Average Partnership Score, Number of Batting Segments, Batting Segment to Wicket Ratio, Average Runs in a Batting Segment, Average Pressure Factor, Pressure of Wickets, Final Score. First they have obtain an optimum subset of attributes for first and second innings of an IPL match separately. For first inning Dot Ball to Runs Ratio, Dot Ball Percentage, Number of Wickets Lost has been chosen with 70.46\% accuracy and for the second inning Pressure of Losing Wickets has been chosen with 88.82\% accuracy. They also have obtained optimum features by dividing innings to three segments as Powerplay, Middle and Death. Then by combining these segments with complete inning, an optimum set of features have been derived with 71.65\% accuracy. The optimum subset of attributes that they have selected for first inning are Four Frequency, Number of Batting Segments, Final Score, Batting Segment to Wicket Ratio (PP), Six Hitting Frequency (PP), Boundary Run Percentage (Middle), Average Runs in Batting Segment (Middle), Average Pressure Factor (Middle), Dot Ball Percentage (Middle), Run Rate (Middle).
6.Outcome Prediction
A cricket match has four possible outcomes; a win, loss, draw, tie. But in ODI matches it is impossible to end the match in a draw. If the second batting team scores more than the first batting team, the match will be won by the second batting team. In such a case the match may end without completing the overs limit and with some wickets on the hand of the second batting team. When the second batting team is unable to score more than the first batting team, the first batting team is won by some runs. A match is said to be tied when both the teams score the same amount of runs. In either case, the match ends with all the ten batsmen being out or completing the overs limit. In some tournaments when a match is tied with the overs limit, both the teams get a chance of a super over. If the super over is again tied, then the team with the highest number of boundaries wins the match. A number of researches have been conducted to predict the outcome of the cricket match.
V. V. Sankaranarayanan et al. came up with a 68\% - 70\% accurate data mining approach to predict the future state and predict the winner of an on-going ODI match. Predicting the future state of the game included predicting the number of runs scored for the next segment. They used two separate models to predict home runs and non-home runs. They considered six historical features and five instantaneous features. The considered historical features are average runs scored by the team in an innings, the average number of wickets lost in an innings, frequency of being all-out, average runs conceded in an innings, the average number of opponent wickets taken in an innings, and Frequency of getting opposition all-out. The considered instantaneous features are home or away, powerplay, target, batsmen performance features, and game snapshot (current score and fallen wickets).
M. Bailey et al. also developed a similar model to the above model to predict the outcome of an on-going ODI match. The factors they considered are a home ground advantage, past performance, match experience, performance at a specific venue, and current form. To predict the match outcome they weighted those factors according to the statistical significance of them. They used the Duckworth-Lewis method to determine resources remaining at the end of each over and used that result to predict the final score of the batting team. M. Gopal Jhanwar et al. developed a 71\% accurate model to predict the outcome of an ODI match using a team composition based supervised learning approach. First, it modeled the potentials of batsmen and bowlers in both the teams. The model then predicted the winning team of the match using the player performance, toss decision, venue, and relative team strength. The model also showed that both the historical data of the players and instantaneous data are needed to predict the outcome of a match.
S. A. D. P. Subasingha et al. came up with a tool to predict the outcome of an ODI match. Their run rate is the only considering factor to predict the final score of the team.
Neeraj Pathak et al. developed a tool COP (Cricket Outcome Predictor) which outputs the probability of winning an ODI match. The model used instantaneous factors analyzed by Ananda Bandulasiri. Those factors were toss outcome, day/night effect, home game advantage, and bat first. They analyzed ten full member nations of ICC and prepared a separate model for each team considering their opposition teams separately. This tool gives the prediction before the match is started Since factors considered in this approach do not change after the match started. The critical tool developed by A. C. Kaluarachchi et al. to predict the outcome of an ODI match is also similar to the COP tool. They also considered the features analyzed by Ananda Bandulasiri. But they revealed that toss winning does not have a major impact on match outcome. But They found that losing the toss and batting second increases the chance of winning while winning the toss and batting second reduces the chance of winning.
A. Nimmagadda et al. proposed a model to predict the winner of the Twenty20 match while the match is in progress. The proposed model projects run scored by the batting team considering the current run rate and other different run rates. They considered relative team strength and venue since the run rate is not enough to predict the final outcome.
7. Sentiment Analysis
Sentiment analysis is analyzing positive, negative, or neutral mentions within text data using text analysis techniques. Apart from the text analysis, this refers to computational linguistics, natural language processing and systematically identifying, extracting, quantifying, and studying affective states and subjective information. Sentimental analysis is also known as name opinion mining. Emotions of cricket fans change when their home country scores run, taking wickets and when losing wickets. Sentiment analysis can be performed with a number of related keywords to analyze cricket fan’s emotions. This can be done using social media platforms like Twitter, Facebook. This approach used to evaluate the popularity of a team.
N. Rodrigues et al. used twitter data and distinguished tweets as positive, negative, and neutral and obtained the popularity of each player. They included that as an IPL franchise league player selecting metrics in their model. The same criteria used in the IPL dream team software developed by Jayshree Hajgude et al. for the use of IPL franchise team owners for the selection of players. Dinesh Samariya et al. illustrated Indian cricket team fans mood change continuously during the cricket match using the twitter data. They proposed an approach which is a combination of corpus-based and dictionary-based techniques. They visualized emotion changes of Indian cricket team fans in separate graphs when the India team is playing with other selected opposite teams.
S. Arafin Mahtab et al. analyzed facebook Bangladesh cricket fan group comments in the Bengali language to analyze the fan emotions of the Bangladesh team. They used a machine learning approach and prepared three sentiment classes about Bangladesh cricket as praise, criticism, and sadness. P. Lakkaraju et al. used SAS (Sentiment Analysis Studio) to extract textual opinions about cricketers. Using this method they ranked players according to the number of times they mentioned in the considered textual data.
8. Methodologies
Analyzing and coming up with the different techniques to model the cricket game made easy by the availability of ball by ball data of matches in the public domain. Some popular sites that provide these data are ESPN CricInfo, Cricsheet, kaggle and Statsguru. These sites are updated for every match. From this data, many types of research have been carried out from time to time and come up with different types of models to evaluate the performances of a player and a team, and predict the outcome of a match. They have used data mining techniques, machine learning techniques, etc. to model the game cricket.
M. M. Rahman et al. has provided an analysis of Bangladesh ODI cricket data of the time period 2005 to 2015. They have collected all these data records from the ESPN CricInfo website. In this analysis, they have used decision tree algorithm C5.0 to predict the outcome of the match while the game is in progress. 10\% of the data have been randomly selected to predict the result(or the test data) and the remaining data have been used in creating the model. V. V. Sankaranarayanan et al. have used the ODI cricket data from January 2011 to July 2012 in their analysis. All these records have been taken from the ESPN CricInfo website. They have used these data in creating a model to predict the future states while the game is in progress. But 20 matches with rain interruption have been removed from the analysis. In creating the model they have used only data mining techniques and some formula. They have not used any machine learning algorithms.
Madan Gopal Jhawar et al. has proposed a team composition based supervised learning approach to predict the outcome of a match. They also have obtained data of ODI matches from 2010 to 2014 from the ESPN CricInfo website. Since they have restricted their study to the top 9 ODI playing teams some data have been excluded. And they have 109 matches that were interrupted by rain. They have used Binary classifiers like SVM(Support Vector Machine), Random Forest, Logistic Regression, Decision Tree, and kNN(k- Nearest Neighbour) with sweep features and no cross-validation in their modeling. The kNN algorithm has shown the best accuracy.
N. Pathak et al. have used classification techniques in predicting the outcome of the ODI cricket match. They also have considered ODI data from the ESPN CricInfo website in the time duration of 2001 to 2015. 80\% of data is used for training the models and 20\% to test. Naïve Bayesian, Random Forest, SVM, classifiers used in modeling, and Naïve Bayesian have shown better performance. Kappa statistics and balanced accuracy has been used for better classification performances. Higher values of these have increased the performances of classification.
A. C. Kaluarachchi et al. has used Bayesian classifiers, Decision Tree Classifiers using C4.5, Bagging, and Boosting to predict the winning team of an ODI cricket match. Since Bayesian classifiers have shown the best results, it was used to develop a software tool called CricAI to output the probability of victory. They have used machine learning techniques like association rule mining, clustering, and classification. They have considered data from 1971 to 2010 of ODI matches obtained from the ESPN CricInfo website.
P. Somaskandhan et al. has used machine learning techniques to come up with an optimal set of attributes that impose a high impact on the end result of a match. In this analysis, they have used IPL ball by ball data from 2008 to 2016. They have trained Extra-tree, Naïve Bayes, and Support Vector Machine (SVM) machine learning algorithms with 80\% of data, and the remaining 20\% have been used for testing. SVM has shown the best results in their analysis.
M. Bailey et al. has used a multiple linear regression model to predict the outcome of an ODI match while the game is in progress. Prior to predicting they have numerically weighted the variables according to their statistical significance. The Margin of Victory(MOV) has been obtained by the multiple linear regression model. This model has shown 71\% of accuracy. Then for 100 matches from 2015 ODI, AAE(Absolute Average Error) between actual and predicted MOV of the team batting first and team batting second has been considered. According to the obtained results, first-innings totals are more accurate than the second innings. But the reduction in AAE has increased in the second inning when the game draws nearer to the end.
A. Bandulasiri predicted the winner of an ODI match using a logistic regression model. They have considered World Cup matches from 1995 to 2007. B. Morley et al. also used a logistic regression model to investigate home advantage and other factors affecting the outcomes in English ODI matches. Logistic regression and graphical “classification and regression tree” approach are used by K. P. Jayalath in his analysis of predicting the outcome of an ODI cricket match.
T. B. Swartz et al. have used a non-machine learning approach called simulated annealing in searching for optimal or nearly optimal batting orders in an ODI match. They have considered only the performance of the Indian cricket team in an ODI match. N. Siva et al. have used the data mining and machine learning approach in performance analysis of the Sri Lankan cricket team. They have considered only IPL and Twenty20 match data obtained from Cricsheet, ESPNcricinfo, and online data mining community Kaggle. K. Passi et al. also has used a machine learning approach to predict the player performance in an ODI match. And the data source is ESPNcricinfo. They also have used the WEKA tool.
S. A. D. P. Subasingha et al. has used data mining techniques to predict the outcome of an ODI cricket match. They have used data from ESPNcricinfo and sites. WEKA tool has been used to build the classifier models.
P. Shah et al. have used exponentially decaying average (EDMA) to evaluate individual player performances. It is a statistical approach to measure the form of an individual player. In calculating the form, simple logic of short term and long term EDMA has been used. The form of a batsman is depicted as a percentage of the ratio of short term EDMA and long term EDMA.
Concepts of Multiple Random Forest Regression have been used by N. Rodrigues et al. in predicting a score for a batsman or a bowler in a given match. This has been used to model the ODI match data.
P. Premkumar et al. proposed a dynamic approach using factor analysis to rank the batsman and bowlers using the data obtained from 2015 ODI matches. In this dynamic model, factor scores are calculated for players using Principal Component Analysis techniques. Since performance metrics of players are highly correlated they have obtained only one factor consisting of all the variables.
P.A. Gregory et al. has used an iterative approach to obtain an optimum set of attributes to which can predict the outcome of IPL cricket matches (501 instances) . Analysis have been carried out using two different approaches. In first approach they have ranked the features using a specific mathematical model. In the second approach accuracies are calculated for different subset of features against a classification algorithm. Feature selection and modeling analysis has been carried out using Filter method. There were three attribute selection algortihms namely CfsSubsetEval (selecting attributes with high ccorrelation and low inter-correlatio), InfoGainAttributeEval (ranking attributes according to information gain and then selecting attibutes) and ReliefFAttributeEval (Selects attributes by repeated sampling). Classification model J48 decision tree algorithm with 10-fold cross validation was trained using the above selected subset of features and accuracies were improved by combining various attributes of a given subset of features. Then they have used both wrapper and filter methods with J48 classifier to analyze and obtain the optimum set of features by segmenting innings. Finally WrapperSubsetEval selection algorithm has return the subset with highest accuracy when combining segmented innings with complete innings.
As discussed above there are many types of research that have been carried out by data mining and machine learning approaches in team and player evaluations and predicting the outcome of the match. Although most of them have used the data mining and machine learning approaches the final model to predict the results have shown some differences due to the different attributes used or due to the difference in considered time period and type of match.
Methodology
Proposed Methodology
The main objectives of this research are recognizing patterns of player combinations that result in the match outcome and predicting the match outcome when the players of two teams and match conditions are provided.
This research is carried under five perspectives.
- Identify features impact on the individual performance In this, the features affecting the individual performance of a player is considered. This research considered new features that were not used in earlier researches. This is carried under three divisions as batsmen, bowlers, and fielders. Using machine learning regression models the feature importance was obtained.\par
- Ranking players considering their individual performance The ranking of players is carried under three divisions as batsmen, bowlers, and fielders. Wicket-keepers also considered as fielders. All-rounders are considered under all three divisions. Considering the features impact on player’s performance a score is calculated for each player. Based on the calculated score player is ranked.
- Identify the combined effect of players Not only the individual performance but also the combined effect of players also impacts the match outcome. This approach is a statistical approach to find beautiful combinations of players where their combined effect is better than the combination of their individual performances. This approach considers batsmen and bowlers separately. This considers n-grams of players like 2-grams, 3-grams.
- Identify frequent player combinations This is an association rule mining approach to find frequent combinations, frequent winning combinations in ODI matches. The combinations obtained by this approach is further compared with the beautiful combinations obtained by considering combined effect of players.
- Predict the match outcome This approach is to build a machine learning model which predicts the outcome of a given match. This model predicts the outcome of a given ODI cricket match under following conditions.
- Two teams should be one of these countries: England, Australia, New Zealand, Sri Lanka, Bangladesh, Pakistan, India, Zimbabwe, West Indies, Afghanistan and Ireland
- The team combination should be given.
- Toss won team should be given.
- Ground should be given.
- Match time should be given as day or day-night match or night match.
In this approach we used the results obtained from the above 1st and 2nd perspectives.
Data Collection
In the first phase of our project we used the career details of batsman and bowlers. And in this phase, second phase, we collected the fielders data, and all the runs scored by all players in each match. So do all these we obtained the data sets from kaggle and ESPN Cricinfo. Those sources included most of the data but there were some required details which were not included there. So we had to enter them manually. Since there were a lot of data it was a very tiring task to gather all those data. In the first phase, although we gathered data for match details form 2010 to 2020, here we shorten that time span to 2015 to 2020. All these data are gathered only for selected number of countries.
Selected countries - ICC full member countries: England, Australia, New Zealand, Sri Lanka, Bangladesh, Pakistan, India, Zimbabwe, West Indies, Afghanistan, South Africa and Ireland
Data Preprocessing
Gathered data sets have a very large amount of samples which makes it difficult to track the missing or any garbage values. Although we have collected number of features, some features are not really important. So in this stage our aim is to transform the raw data that we gathered from various sources into a useful format so that it is ready to use for analysing. Following are some of the things that we had to face when preprocessing the raw dataset.
- The height of some players was not stated in data sources. Therefore we treated them as missing values and replaced them with class mean of the attribute.
- Similar situation happen with the man of the match feature of a player. So we had to replace those missing values with 0.
- Missing data of batting style and bowling style were replaced using class mode of that attribute.
- Bowlers and fielders first dataset had many missing career details. So we had to remove about a lot of players since we can not predict some required features.
- Removed the matches that did not have a final result or tied matches.
Individual Player Performance
Individual performance of players is considered separately as batsmen, bowlers, and fielders. Different features contribute in different priorities when comparing the players. Some features show different importance levels in different match types. In prior to rank the players, the features were weighted according to their priorities among each other. For that, we used AHP(Analytic Hierarchy Process).
Following are the steps we followed in calculating the weights for each feature after selecting the feature importance values from the model which gave highest accuracy.
- Using the feature importance, we did a pairwise comparison between each feature importance with all other features’ importance. There we created a matrix to compare each of the features.
- Then, we found the priorities of each attributes when compared to the other attributes with the help of the matrix created. Following equation was used to find priorities.
Score Prediction
We needed to do a comparison between the players. So, we calculated a new feature ‘score’ for each player; a score for each batsman and a score for each bowler as batsman, bowler and fielder. All-rounders get three ranks because of this. This new feature was derived using the values of previously used features; using carrier features and all features corresponding to each player and the weights of each feature calculated. When ranking batsmen, bowlers and fielders we considered the score predicted by the above mentioned methods. We considered three features to obtain three different scores for same fielder. We followed same approach to score batsmen and bowlers. Then the best score can be choose by considering the other factors affect on the match and the team. The three features considered for fielders are number of dismissals, average dismissals per inning, average dismissals per inning of winning matches.The three features considered for batsmen are overall runs, average and winning average. The three class attributes considered for bowlers are overall wickets, average wickets and winning average wickets. Following equation was used for this considering importance of features.
Combined Player Performance
For combined player performance, we did a comparative analysis of it with the sum of individual player performances. Players in a team are considered in batsman and bowler categories. Their combined performances were taken considering different combinations like 2-grams, 3-grams and 4-grams for a specific feature in each category.Then we took the sum of individual performances from specific feature from each category which matches the combination type of combined performances. Using those two values, we did a comparative analysis.
Frequent Player Combinations
For this analysis we used Association Rules. This depicted how frequent a player combination has occurred together, in a team and led the team to victory. Association rules use the support and the confidence to interpret this situation.
- Itemset : All items occurring in a rule
- Antecedent : Contains the different player combinations (number of players in a combination is always greater than 1). Generally we called it as the items found within the data.
- Consequent : In a particular rule this will always be the “won” (means the result of the considered match). Generally this means the output that happens if a particular itemset occurred.
- Confidence : Number of correct rules with the considered player combination and won the match
Outcome Prediction
For outcome prediction of a ODI match we build a outcome prediction model using machine learning classification models. This is a binary classification problem, since we are predicting won or loss result of the match. The draw matches and abandoned matches were excluded from the dataset. Both existing match features and derived features from the individual player performances considered for this outcome prediction. 70% of data used as the training set and other 30% used as the test set. The data set was balanced dataset.
Experiment Setup and Implementation
Research Tools
To achieve our goal we have used machine learning libraries used in python.
- scikit learn - A machine learning library for python which includes algortihms of different classifiers, regressors etc.
- Pandas - Used for data manipulation and analysis.Handling data structures and operations
- Numpy - Supports for multidimensional arrays and matrices. Contains a large number of high-level mathematical functions
- Matplotlib - A plotting library. Helpful in visualising relations between features.
- Apriori - An algorithm for frequent itemset mining and association rule learning.
Inorder to collabaratively work on the codes, we used Google Colab; an online tool with jupyter notebook environment.It was very helpful Since it contains all the required machine learning libraries for python.
Data manipulation and Testing
Our initial data sets were already in .csv which is a format that we can use in building up our models and tested. But, as mentioned before, we were not able to find all the required fields in one source. So we had to go through manual process to add the players height, and man of the match and number of hat-tricks of bowlers features to these data sets. Even after filling all the required fields there were some missing values. So first we had to go through data preprocessing process.
Regression and Feature Importance Selection Methods
All the class attributes we considered for the batsmen and bowlers with different feature combinations were numeric type. Therefore we had to use regression to build up machine learning models. The regressors used in our study are random forest regression, Decision tree regression, XGBoost regression, k-neighbours regression and linear regression.
Random Forest Regression
Random forests use ensemble learning methods to build up the regression model and construct multitude of decision trees at training time. After fitting the model feature importances property can be used to take importance of input features.
CART - Decision Tree Regression
Decision tree regression builds regression model in the form of a tree structure. It breaks down a dataset into smaller and smaller subsets while at the same time an associated decision tree is incrementally developed. The final result is a tree with decision nodes and leaf nodes. After fitting the model feature importances property can be used to take importance of input features.
XGBoost regression
XGBoost is a library that provides an efficient and effective implementation of the stochastic gradient boosting algorithm. XGBRegressor is the class in the XGBoost that can be used for regression. After fitting data to the model there is a property in model called feature importances which can be use to find the importances of features used to build up the model.
k-neighbours regression
k-NN regression, the k-NN algorithm is used for estimating continuous variables and the permutation testing canbe used to get the feature importance of each input feature.
Linear Regression
Linear Regression is in sklearn.linear model and after fitting this regression model the coeff property includes the importance in each feature that is used to build the model.
Features Considered
Batsmen
- Man of the match - Number of man of the match awards won by the player
- Last 4 matches runs mean - Average of runs taken by player in his last 4 matches
- Height(cm) - Height of the player
- Batting Style - Whether batsman is right handed or not
- Average - Batting average throughout his carrear
- NO - number of notouts
- HS - Highest score
- HS_NO - Whether highest score played, and out or not
- SR - Strike rate
- 100s - number of 100s scored
- 50s - number of 50s scored
- 0s - number of times that batsmen out for 0
- Mat - Number of matches
- Inns - Number of innings
Bowlers
- Man of the match - Number of man of the match awards won by the player
- 4 - number of times 4 wickets were taken
- 5 - number of times 5 wickets were taken
- Height(cm) - Height of the player
- Bowling style
- Econ - Economy of the bowler
- Hattricks - number of times 3 wickets were taken on a row
- SR - Strike rate
- Average - Batting average throughout his carrear
- BBI - Best bowling
- Mat - Number of matches
- Inns - Number of innings
Fielders
- Man of the match - Number of man of the match awards won by the player
- Dis - Number of dismissals taken by the player
- Height(cm) - Height of the player
- Ct - Number of catches
- St - Number of stumps
- Ct Wk - Number of catches as wicket-keeper
- Ct Fi - Number of catches as fielder
- MD - Maximum number of dismissals recorded by the player in a match
- MDct - Maximum number of catches recorded by the player in a match
- Inns - Number of innings
- MDst - Maximum number of stumps recorded by the player in a match
Outcome Prediction
- Team - Name of the country from the considered 12 ICC full member countries
- Day-Night - Whether match is a day match or day and night match or night match
- Home - Whether match is playing in the country which team belongs to or not
- Ground - Name of the ground where match is playing
- Toss - Toss result, whether toss won or loss
- Bat - Whether bat first or second
- Opposition - Opposition team name
- Batsmen Score - Sum of individual batsmen score of players of the team. This individual batsmen score is refers to the batsmen score obtained in this research’s individual performance section.
- Bowlers Score - Sum of individual bowlers score of players of the team. This individual bowlers score is refers to the bowlers score obtained in this research’s individual performance section.
- Fielders Score - Sum of individual fielders score of players of the team. This individual fielders score is refers to the fielders score obtained in this research’s individual performance section.
- Opposite Batsmen Score - Sum of individual batsmen score of players of the opposition team. This individual batsmen score is refers to the batsmen score obtained in this research’s individual performance section.
- Opposite Bowlers Score - Sum of individual bowlers score of players of the opposition team. This individual bowlers score is refers to the bowlers score obtained in this research’s individual performance section.
- Opposite Fielders Score - Sum of individual fielders score of players of the opposition team. This individual fielders score is refers to the fielders score obtained in this research’s individual performance section.
Pitfalls and workarounds
There were several pitfalls that we had to face during the project. The first thing was that we had to gather some background knowledge about cricket since we were not much familiar with the game and not experienced with it. Also we had to find out how different features affect a player or a team, what is measured or depicted by each feature and what features affect each cricket game type. For example, in bowling, strike rate would become an important feature for limited over matches since scoring as much as possible is very important in those matches. Even there was sources to collect data, data organization in the required format, new features creation according to the needs of the our method was the biggest challenge. One challenge was to come up with a method to find values for the new feature ‘scores’ of each player. So for that we followed some papers and their methods. In those methods, there was no way to find the feature importance comparison matrix. For that, we got the feature importance given by the highest accuracy model that we trained as an input and found the importance comparison matrix. When finding scores for bowlers, for some class values, we got nan values for priorities and weights for some models that we selected. So we had to change the model that we selected. For the statistical method of frequent player combination comparison, we tried to find combinations of players up to 11-grams. But we did not have enough CPU performance power to do that. Therefore we only considered 2,3,4 grams of players. When building the outcome prediction model, we considered the sum of scores that we calculated for the players considering their individual performance. Since we calculated several scores for each player, there were huge number of combinations of batsmen,bowler and fielder scores to consider. Therefore selection of good combination of bating, bowling, fielding scores as attributes for final model was a problem. We selected few scores with different behaviors and selected the best combination considering the outcome prediction model accuracy.
Results and Analysis
Results
We used several methods to obtain several values for same player considering two feature combinations and different class attributes. Feature importance of each method took from the feature importance for the best accuracy model of each method. Then got pairwise feature importance matrix for each followed method for batsmen and bowlers.
Individual Performance
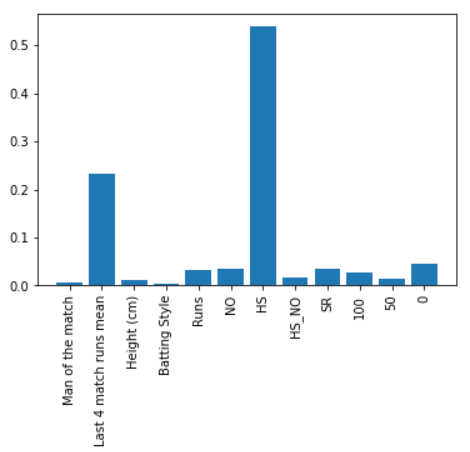
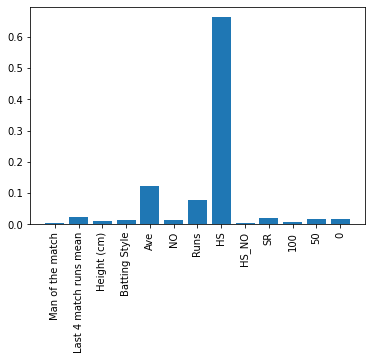
1.Batsmen We considered several feature combinations and different class attributes to obtain score for batsmen. But for the final outcome prediction model we used the scores set obtained using the career features and the class attribute : Overall Runs.
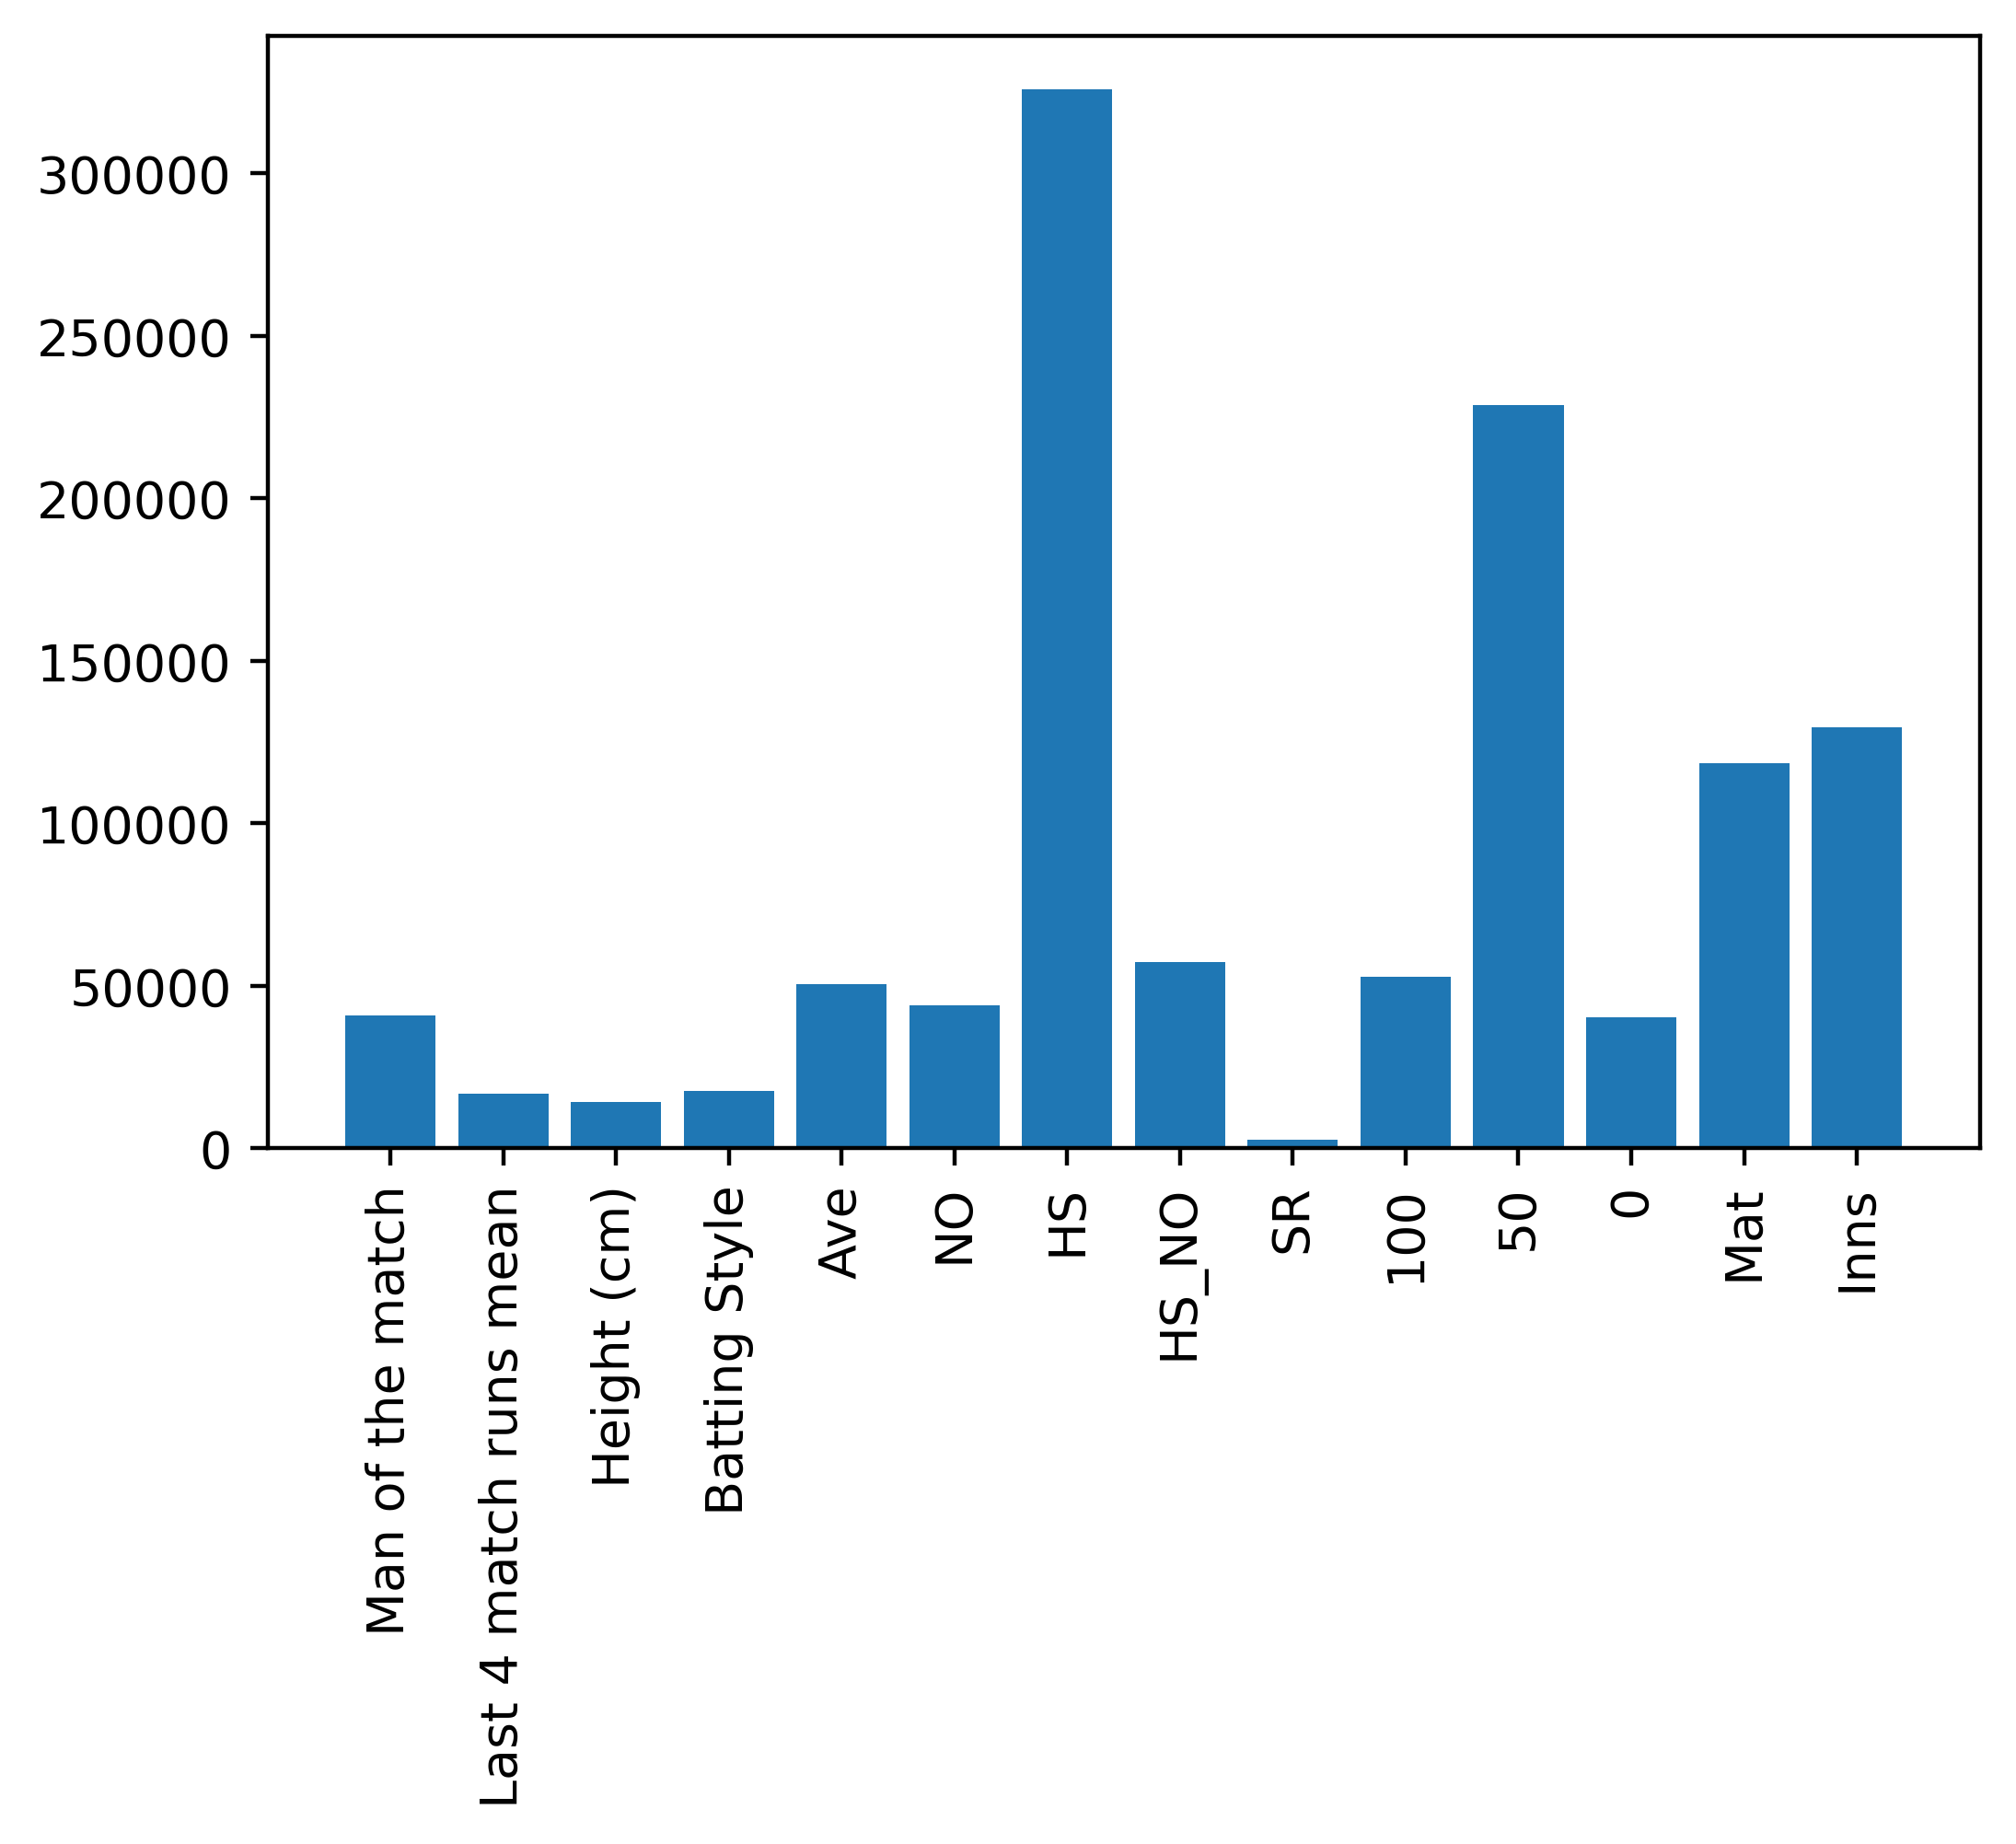 Feature Importance: All Features combination Batsmen and class attribute: Overall Runs
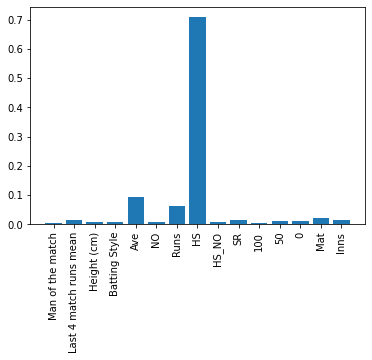
 Feature Importance: All Features combination Batsmen and class attribute: Batting Average
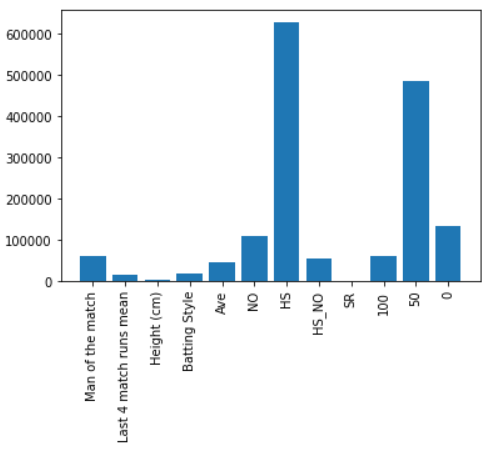
 Feature Importance: All Features combination Batsmen and class attribute: Winning Average
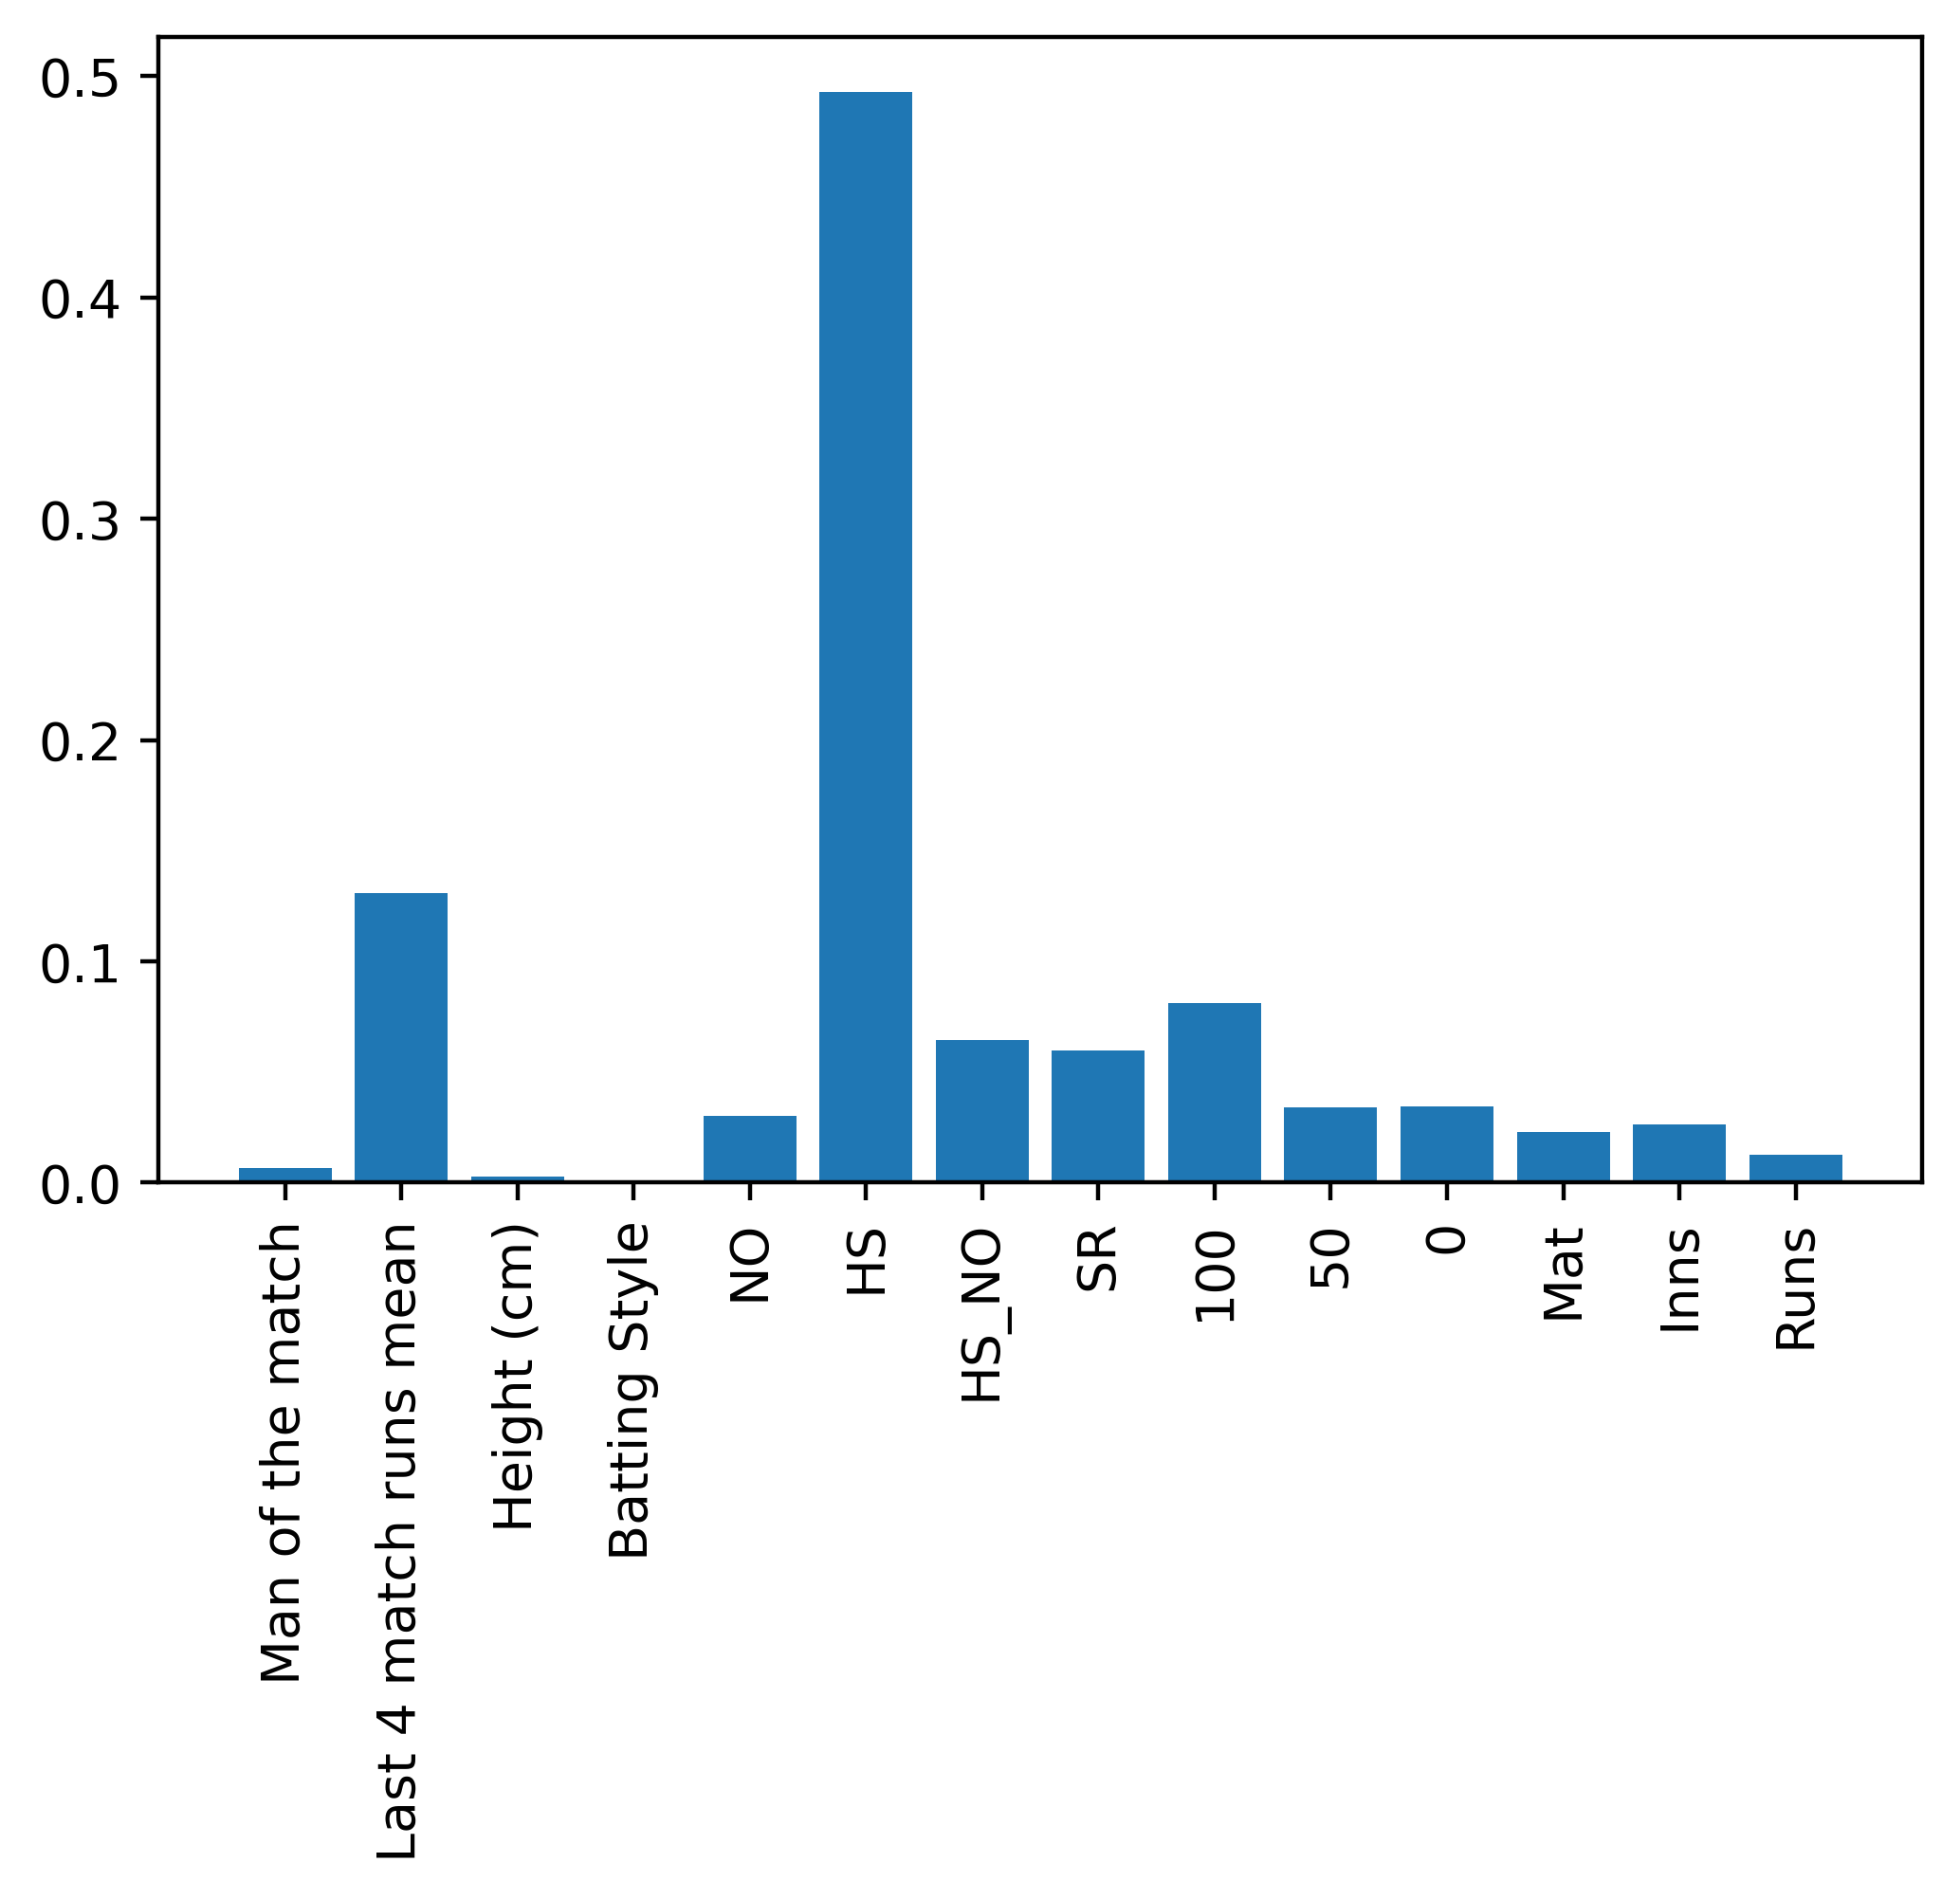
 Feature Importance: Career Features combination Batsmen and class attribute: overall runs
 Feature Importance: Career Features combination Batsmen and class attribute: batting average
 Feature Importance: Career Features combination Batsmen and class attribute: Winning Average
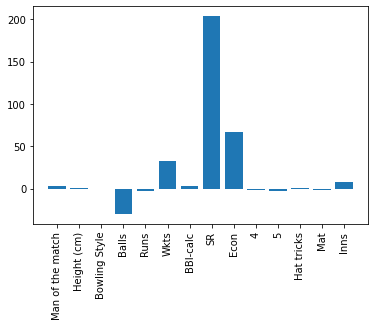
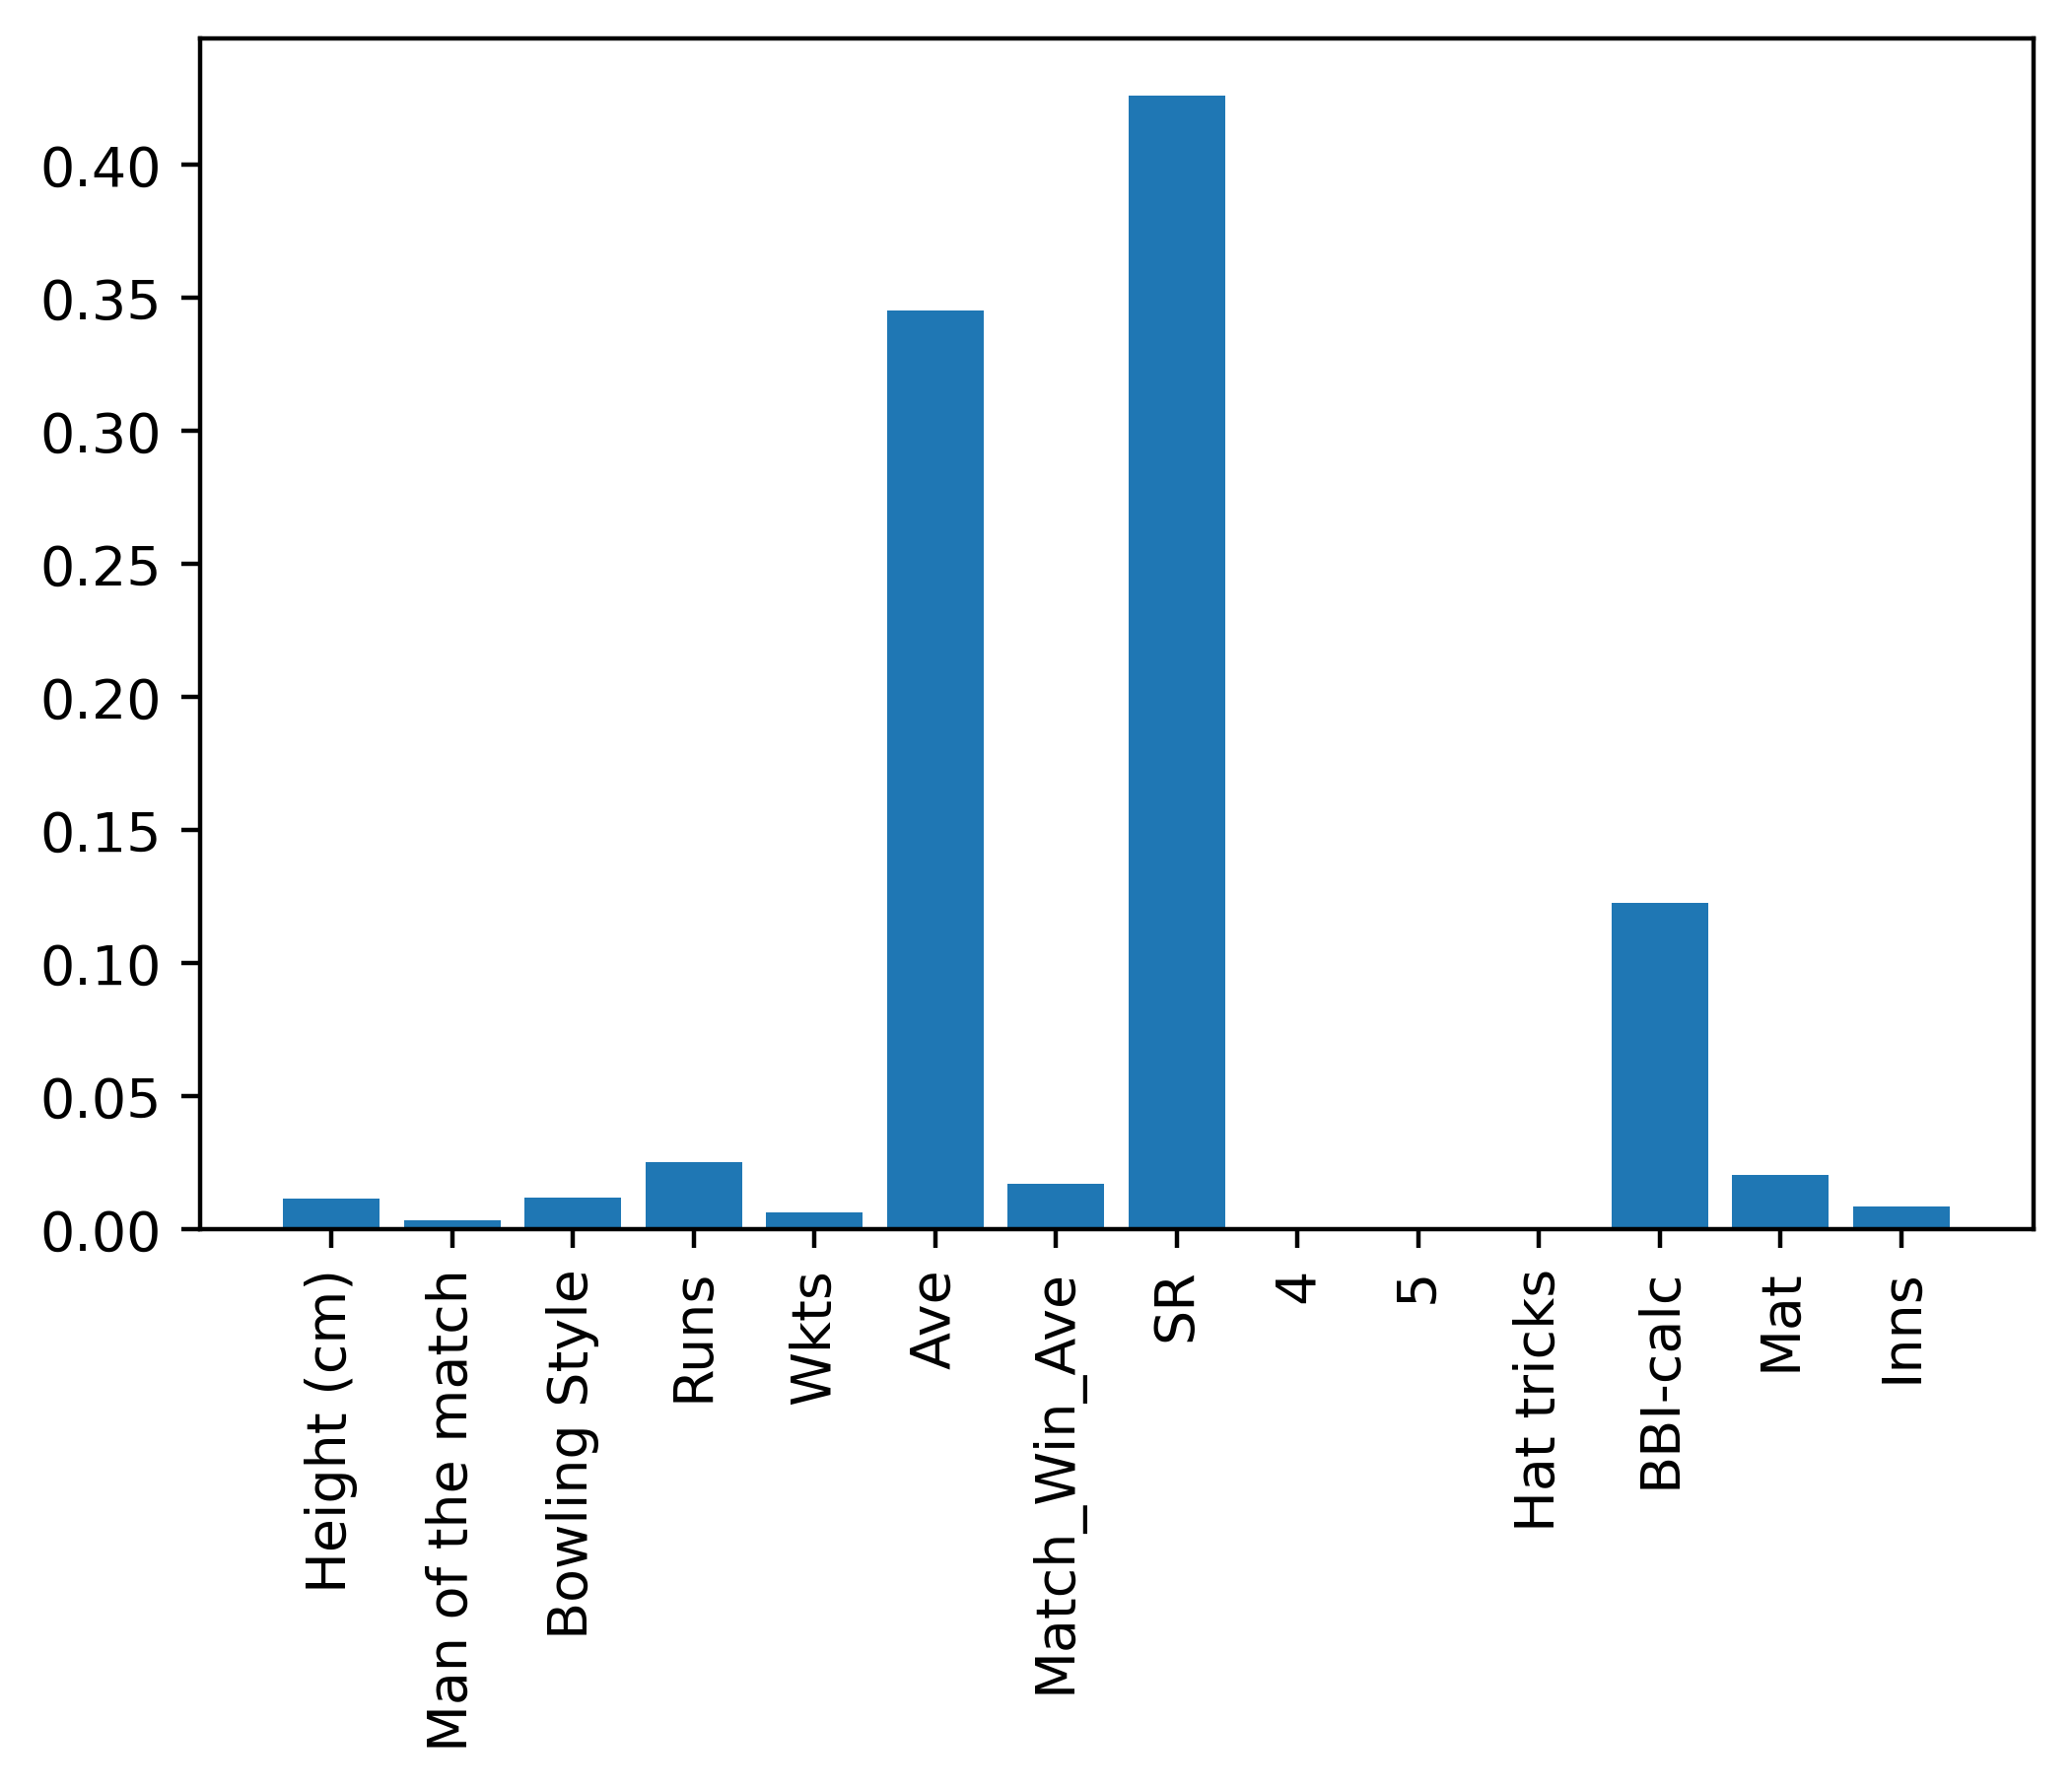
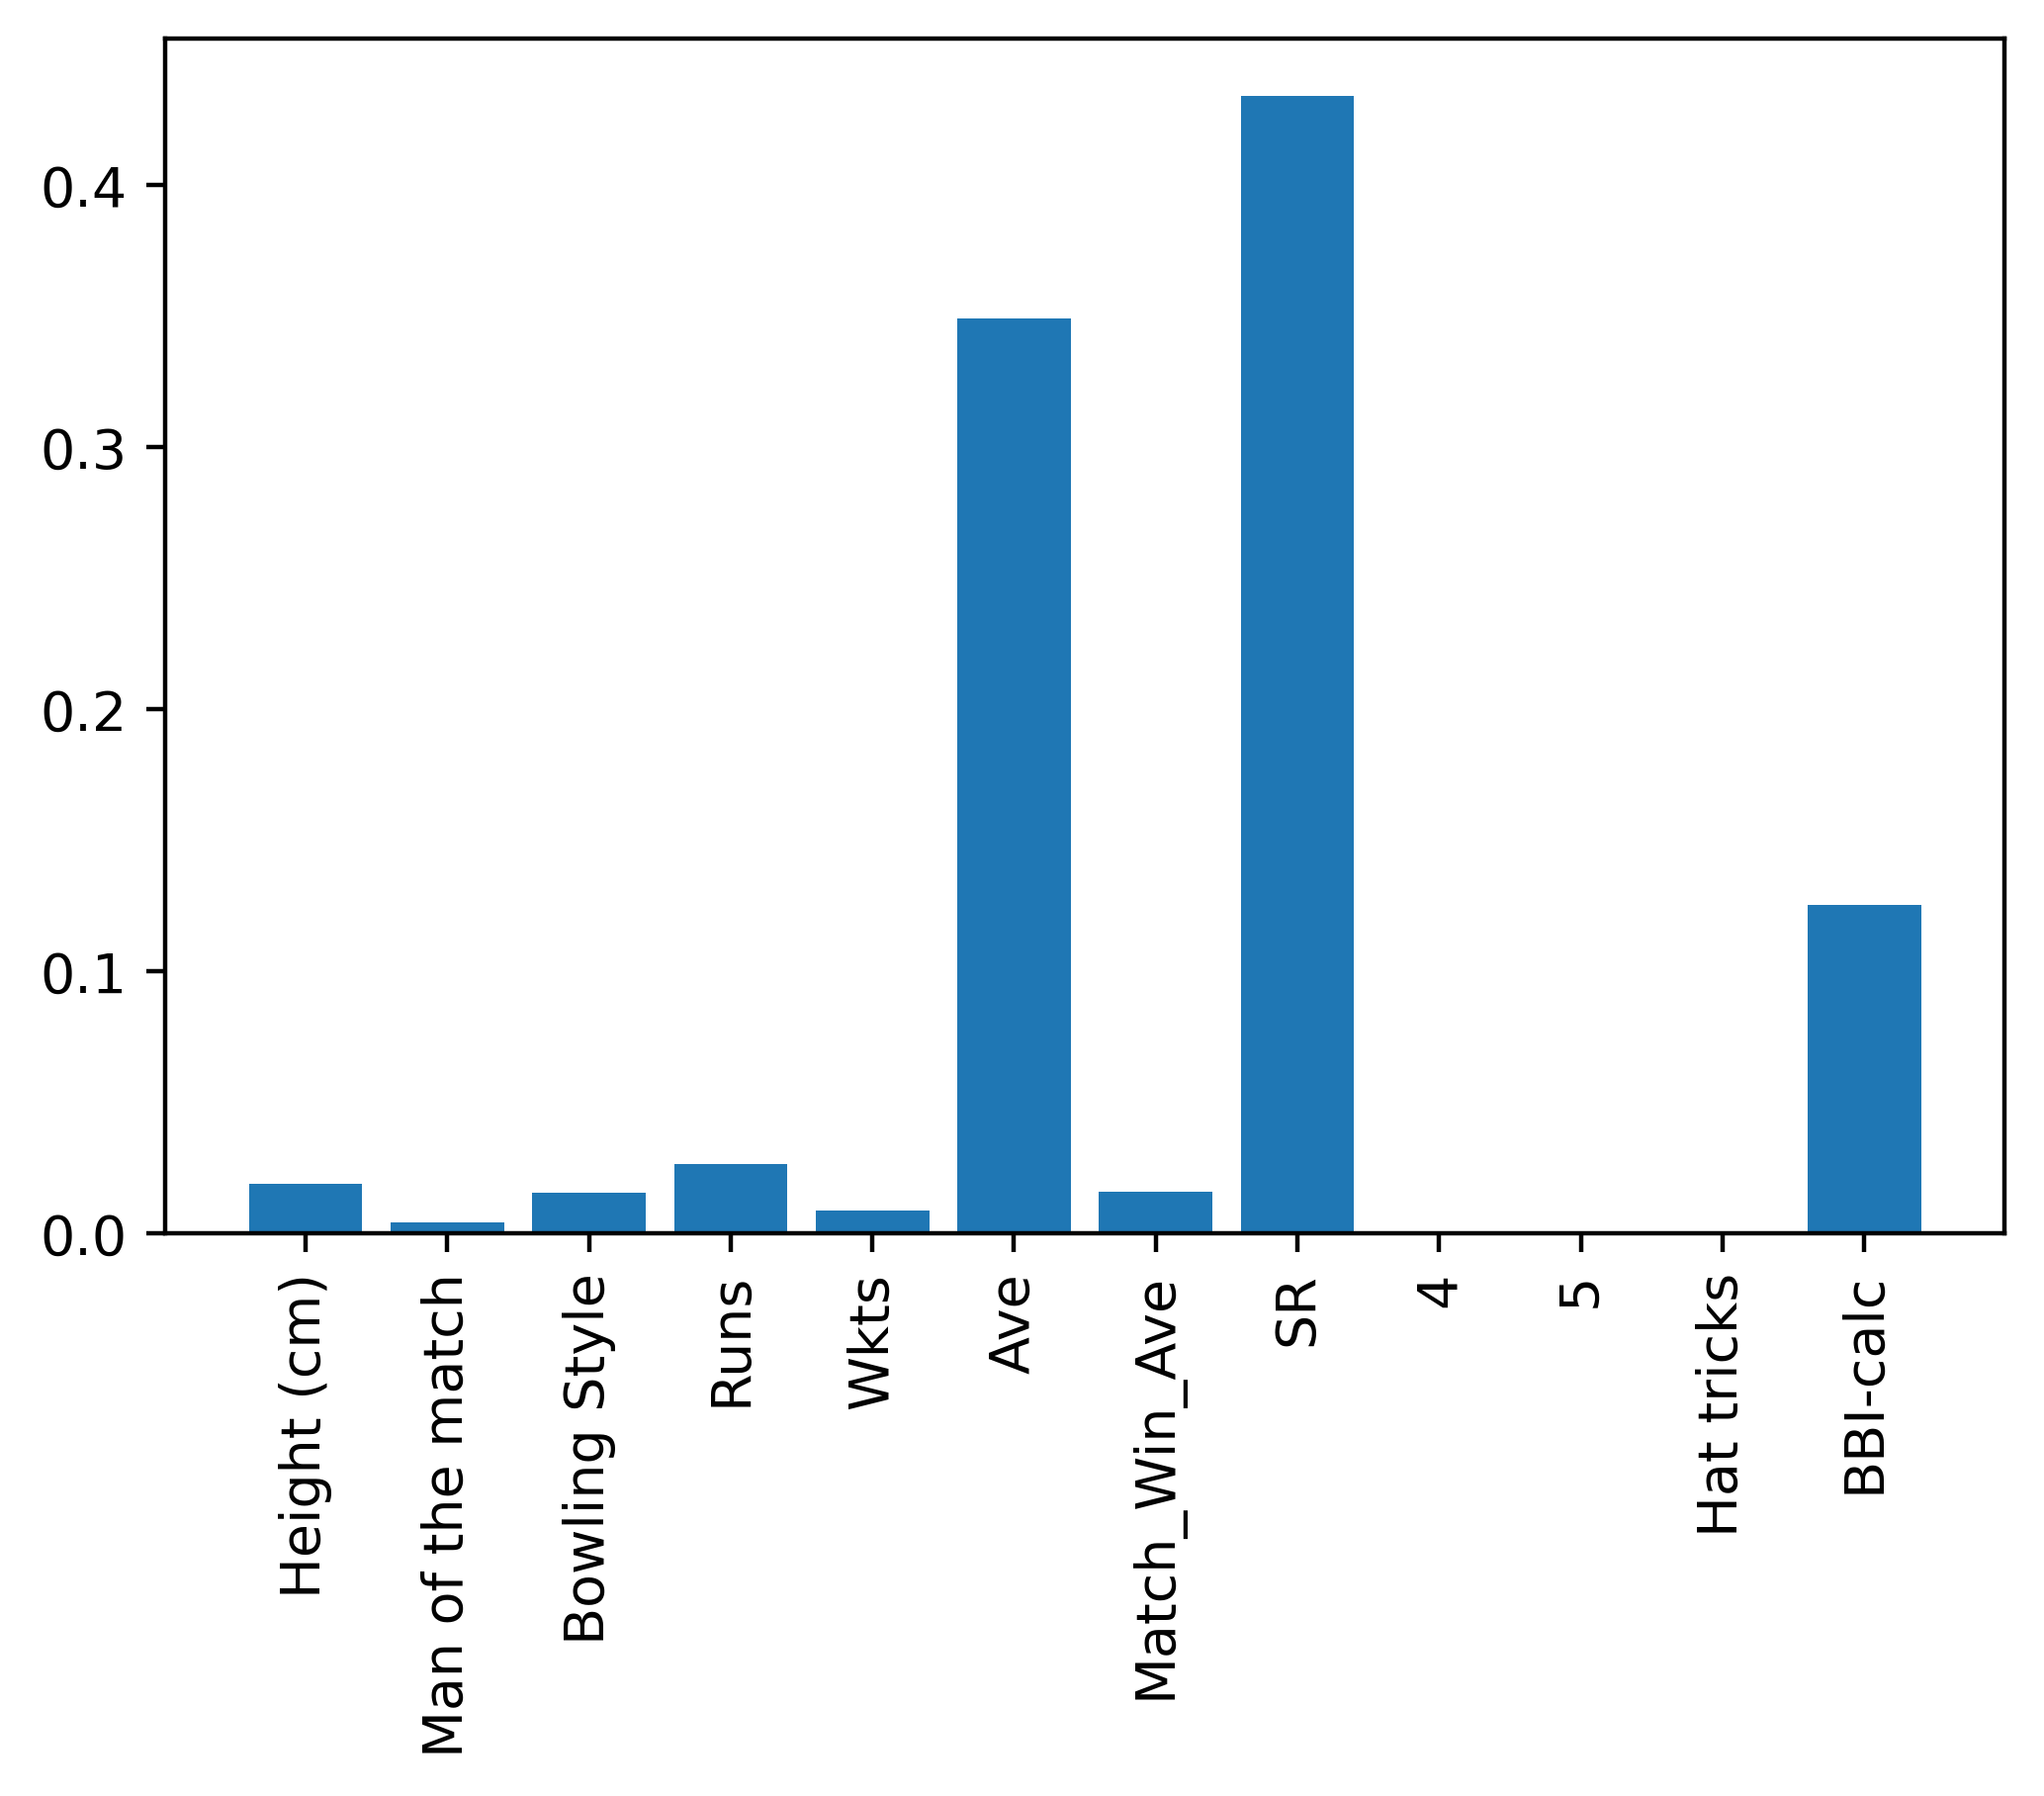
2.Bowlers We considered several feature combinations and different class attributes to obtain score for bowlers. But for the final outcome prediction model we used the scores set obtained using the all features and the class attribute : Overall Wickets.
 Feature Importance: All Features combination Bowlers and class attribute: Wickets
 Feature Importance: All Features combination Bowlers and class attribute: Bowling Average
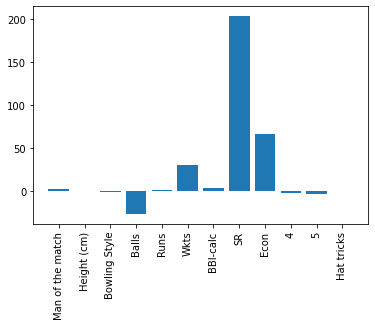
 Feature Importance: All Features combination Bowlers and class attribute: Economy
 Feature Importance: Carrier Features combination Bowlers and class attribute: Wickets
 Feature Importance: Carrier Features combination Bowlers and class attribute: Bowling Average
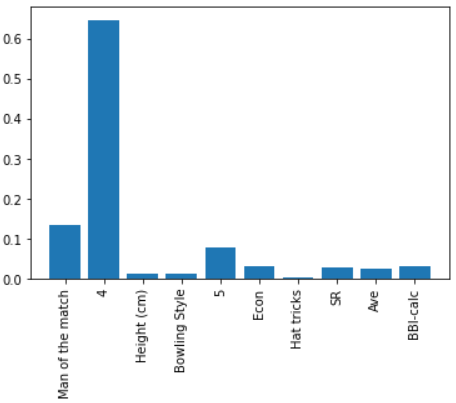
 Feature Importance: Career Features combination Bowlers and class attribute: Economy
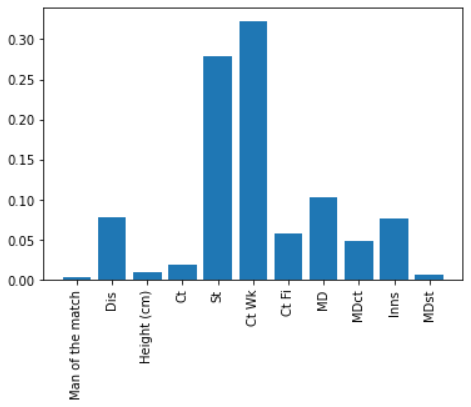
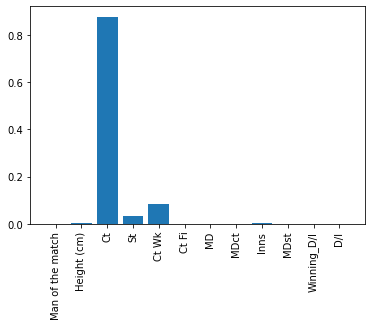
3.Fielders -Class Attribute : Dismissals per innings XGBoost had the best accuracy. Therefore XGBoostalgorithm was used in calculating feature importance for each of the features,relevent to all the other features. Eventually these values are used in prioritiz-ing and assigning weights on the features. Then this weights used to calculate the fielders scores.
-Class Attribute : Winning dismissals per innings Again the highest accurate model was XGBoost. Weights and priorities for this model was then calculated and took the scores of the players.
-Class Attribute : Dismissals(Dis) andom Forest Regressor model was used in calculating feature importance for each of the features relevant to all the other features.Then these values were used in prioritizing and assigning weights on thefeatures. Then these weights were used to calculate the fielders scores.
 Feature Importance of Fielders and class attribute: Dismissals per Innings
 Feature Importance of Fielders and class attribute: Winning dismissals per Innings
 Feature Importance of Fielders and class attribute: Dismissals
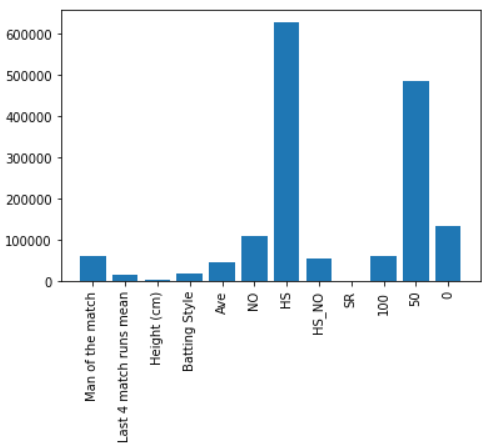
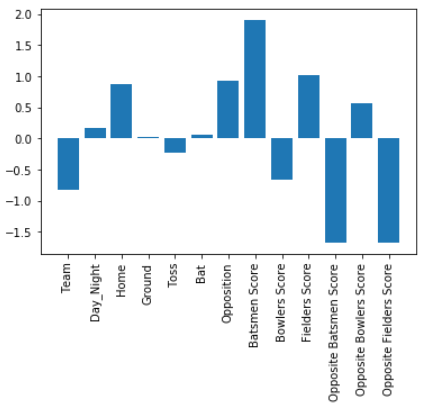 Impact of all the features for the outcome prediction model build using all the features
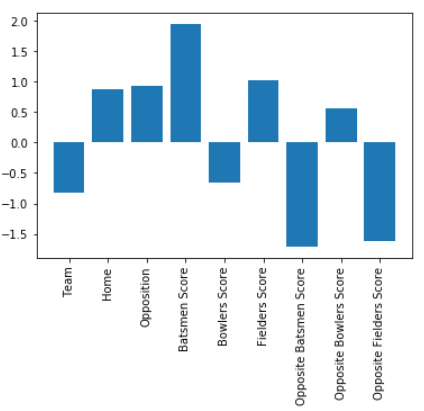 Impact of the features for the final outcome prediction model
From the above two fielder score sets we selected score set in Class Attribute : Dismissals(Dis) for the calculation of fielders score and opposite fielders score features for final outcome prediction model. This feature set was selected considering the accuracy of thefinal outcome prediction model.
Team Performance
1.Combined Average For the combined average, we considered both win and lose matches and only winmatches of all 12 ICC full member countries. This was found for batsmen andbowlers.
-Batsmen Here, we are considering the average of runs. i. Win and lose Match results ii. Win match results
-Bowlers For the bowlers the combined results were taken considering three approaches.Here, we considered the average runs conceded and wickets taken by thebowlers.
- Combinations of players that satisfy combined averages of runs given bythe considering n-gram of bowlers < Addition of their individual averages ofruns given by them
- Combinations of players that satisfy combined averages of wickets >Addition of their individual Wickets
- Combinations of players that satisfy both the 1 and 2 conditions above
- Win and lose Match results for batsmen
- Frequent Combinations We analysed different winning player combinations occurred in 12 countries using association rules. -Without Player Position
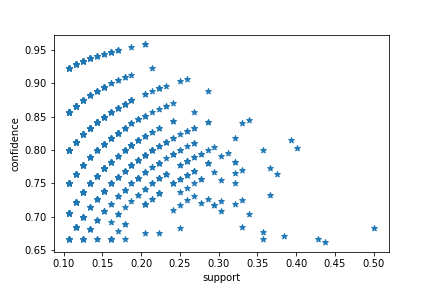 Distribution of India association rules
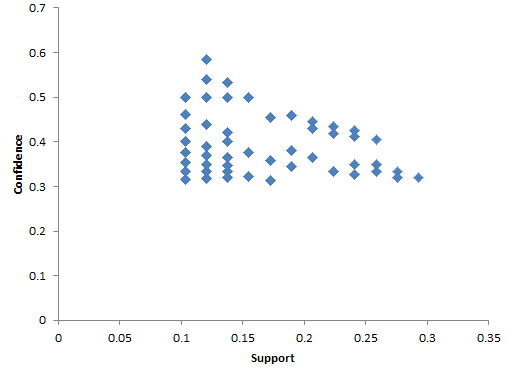 Distribution of Ireland association rules
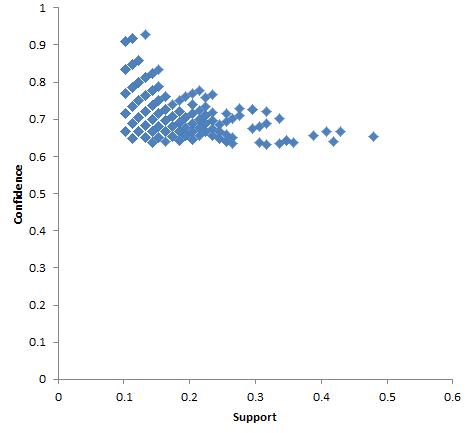 Distribution of South Africa association rules
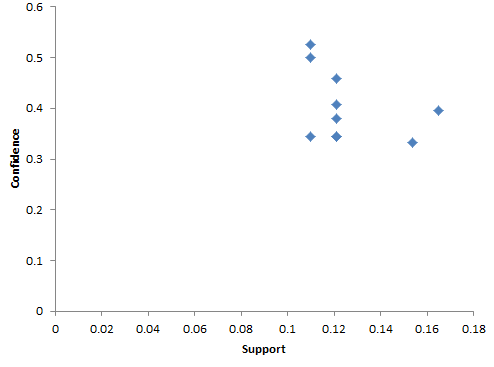 Distribution of West Indies association rules
-With Player Position
- Comparing Frequent Combinations Rules with Batsman Combined Av-erage Association rules that we have obtained for wining player combinations in teamswere compared with the previously obtained batsman combined averages. Thiswas compared for 2-grams, 3-grams etc. of player combinations.
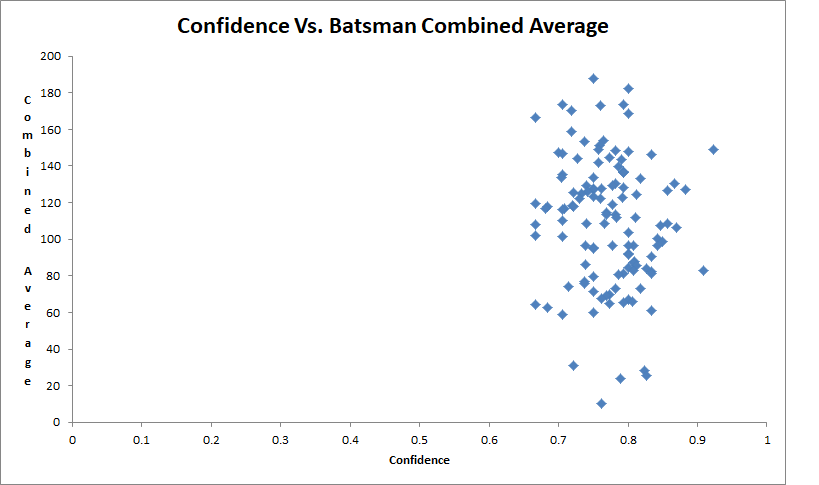 Distribution of Confidence in India association rules against Batsman combined average
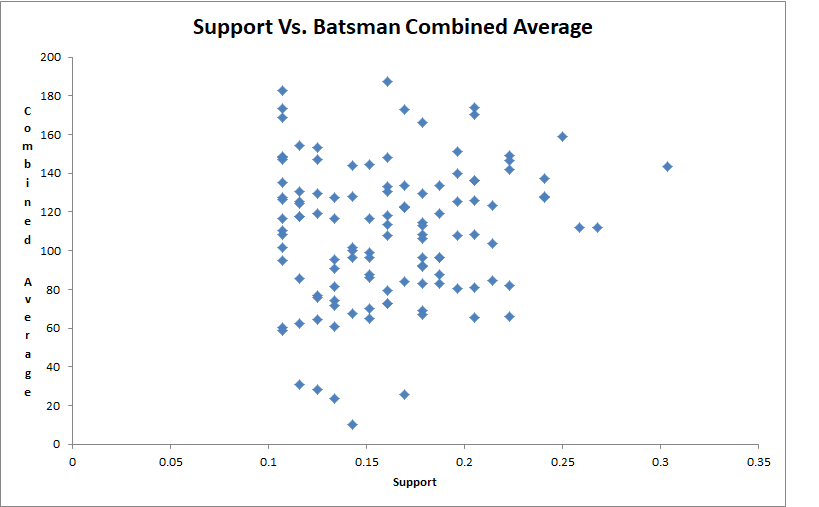 Distribution of Support in India association rules against Batsman combined average
Conclusion
Cricket is a sport with a huge fan base. So winning a cricket match has become a great honor for some countries. With this popularity, there are a number of bets on predicting the outcome of a cricket match. Therefore it has become a challenge to form a cricket team with best performance player ultimately which lead the cricket team to win. So in this study our aim was to model ODI playing batsmen and bowlers and score their performances accordingly. This study has presented priorities of each features of players and their weights. We considered five new features which were not considered before. Namely player’s height, the number of times they have won the man of the match, not out state when playing highest score and for bowlers number of hat-tricks they have taken and the BBI. Most of the other features considered in this study have used in previous researches. From this study we can conclude that man of the match, height, not out state when playing highest score, hat-tricks and BBI features has comparatively lesser weights in all of the different methods that we used to model batsmen and bowlers. From our results up to now different co-relations among different features have given higher weights on those features. As for the frequent player combinations, what we can conclude is that we cannot predict that having a certain player combination in a team will win the match.
Our outcome prediction model was considered six new features which was not used in earlier researches. The importance of these six features is, those features were derived considering the individual performance of the players. The newly introduced six features are batsmen score, bowlers score, fielders score, opposite batsmen score, opposite bowlers score, opposite fielders score. These six features showed very much considerable impact on the final model.