
Near-IR Spectroscopy
Team
- E/15/383, Keshara Weerasinghe, email
- E/15/349, Shamal Tennakoon, email
- E/15/188, Nithya Kularatne, email
Supervisors
Table of content
- Abstract
- Related works
- Methodology
- Experiment Setup and Implementation
- Results and Analysis
- Conclusion
- Publications
- Links
Abstract
Near-Infrared spectroscopy is used for better vein visualization to make the venipuncture process more efficient. While there exist a few models which use the said mechanism, these models are costly, have accuracy issues, and are limited only to certain types of skin tones. Some of the available devices use image-guided venipuncture technique and the others use projection. We propose a low-cost mechanism of obtaining near-infrared spectroscopy by using the image-guided technique. We decided on using this technique after assessing both the available techniques. The low-cost is achieved by optimizing the image processing algorithms and adjusting the illumination method. We have tested and optimized the algorithms accordingly. We use near-infrared LEDs as the source of illumination, and a CMOS camera for image acquisition. Images are processed using OpenCV, and Histogram equalization and CLAHE algorithms are used in preprocessing. Initially, we processed the still images and later on developed the model to process the live video stream and display the processed video footage that visualizes the veins in real-time. We display the vein map on a 7 inch IPS LCD screen.
We have tested the prototype using different combinations of light sources with different intensities and have analyzed the results. We have also analyzed how the results vary based on body fat. In order to quantitatively analyze, we have obtained a count of the number of visible veins and depicted the comparison in a graph. We have concluded that a higher intensity does not always increase the visibility of veins. Our plan is to conduct a clinical trial and test the device on human subjects and get the feedback from both the patients and phlebotomists and improve the model so that those final users are satisfied.
Methodology
3.1 Conceptual design
Our task is to design and develop a device capable of detecting veins belonging to a particular region and display them on a portable screen accurately. The entire process – detection and display occur in real-time. The overall procedure can be divided into a few basic sub-components.
3.1.1 Identifying the optimum wave length for lighting and obtain the appropriate light sources
We obtained a variety of different sources of the near IR region. Here, we determined parameters such as the optimum wavelength, intensity, and lighting conditions, thereby the environment where image capturing should occur and the placement of the object. This step is a prerequisite for image capturing.
3.1.2 Image capturing
Once the light sources were selected, we proceeded with the capturing of images. For this purpose, we use a modified CMOS camera and, with the help of the light source, illuminate the object of interest and capture it. Later on, we progress to capturing a live stream instead of a still image.
3.1.3 Preprocessing of the images
Once an image is acquired, preprocessing steps are applied. These steps utilize image processing techniques to enhance the region of interest in a captured image (for example, the vein pattern in hand). The main objective is to create a visible contrast between the Region of Interest and its surroundings. The same preprocessing procedures are implemented for video capturing as well.
3.1.4 Applying a formulated algorithm to clearly visualize and extract the vein patterns
After preprocessing, we focus on extracting the region of interest from the image. Here, we isolate only the vein pattern from the body part captured in the image and that will be used as the image that is displayed on the screen. This task is a bit complex as we need to develop an algorithm that is capable of performing this task both efficiently and accurately. The algorithm contains several fundamental steps that are discussed under the methodological approach and extensively under the Implementation section.
3.1.5 Designing a interface to display the live stream obtained from the camera
A user interface is created in order to display the live video stream captured from the image sensor. It is capable of showing the video footage that has gone through image processing to clearly portray the veins real time. More details regarding this is stated under the implementation segment.
3.2 Methodological approach
We were able to assemble pieces of hardware to form a fully functioning hardware setup which captures the image and feeds it to a microprocessor where all the image processing is handled, and is displayed on the screen in real-time. As a final step we planned to do a clinical trial and get the feedback from the actual final users.
3.2.1 Hardware setup, modifications and assembly
NIR light source – These light sources fall under 760 – 940 nm waveband and the emitted light is absorbed by deoxygenated hemoglobin that circulates within the peripheral veins. Attention is given to the arrangement of the NIR LEDs, the number of LEDs used, their positioning and distance. In our setup they are fixed in concentric circles with the camera located at the center of the circle. The wavelength of a NIR source can be precisely measured with the use of a spectrometer which we were able to build and calibrate. Image sensor – This part of the setup captures the image that is illuminated by the light source. The image sensor that we are using currently is a NOIR image sensor that has no IR filter attached to it. The sensor captures an image of the object that is illuminated by the NIR sources and the resulting image displays highlighted (mildly) vein patterns. A high-pass filter is used to cutoff the radiation below 750 nm. Microprocessor – This is where the processing of the acquired image takes place. A raspberry pi 3 is used, and all the hardware components are interfaced with it. The image processing is executed by the microprocessor and the result is sent to be streamed live that will be displayed on the screen. Image display – The Image that is acquired and processed, is displayed on a 7 inch IPS LCD panel so that the phlebotomist can be guided by showing the positions of the veins accurately.
3.2.2 Image processing
Image processing is performing operations on an image/set of images to get an enhanced image or to extract some useful information from it. Our objective is to use image processing techniques to identify the vein patterns of an image and its extraction. The Open CV python package along with some basic applications of machine learning (classification and clustering algorithms) are used for vein detection and extraction. The entire process comprises of 3 important phases.
• Background removal : This is the initial phase. For our application, we need only the region of the hand (or some specific body part) where veins are located, and the rest can be considered as noise and therefore eliminated. More details on how this is implemented is discussed under implementation section.
• Preprocessing : This is the initial phase where the raw image is enhanced to show the vein patterns clearly with comparison to the tissue. More details on how this is implemented is discussed under implementation section.
• Algorithm Development and Optimization : This is the most crucial phase of the entire process. It involves developing an algorithm to distinguish and derive the vein pattern from the image with a good accuracy. The general functionality of the algorithm can be expressed by following elementary steps.
- Eliminate the background of the image and isolate only the region of interest
- Increase the contrast of the image with the use of histogram equalization and CLAHE algorithm
- Use morphological transformations on the resulting image to tone down lines and edges.
- Smoothen and noise reduction using techniques such as median blur, bilateral filters.
- Segregate the pixels of the image into clusters based on the color of each pixel. Colors are assigned to each cluster to help identify and distinguish the components of the image from one another.
- Use Edge detection to separate the vein patterns - canny edge detection, Laplacian gradients, Sobel combined.
- Use adaptive thresholding to get the processed image.
- Separate the vein from the processed image, color them, and overlay the pattern onto the original image to see a clear and contrasting vein pattern.
3.3 Assumptions and constraints
Some problems arose when trying to find/verify the wavelength of the IR sources with the spectrometer and we were not able buy a variety of sources with different wave lengths due to the prevailing situation of the country. Therefore, we assumed that the wavelength of the sources that we currently have are accurate. Since the NOIR image sensor has no IR filter, it acquires all bands of light instead of just IR which affects the contrast of the image that is due to undergo processing. Therefore, we use a high-pass filter so that only the radiation above 750 nm is allowed to pass through. When trying to remove the background of an image, the current implementation relies on the color of each pixel to identify possible edges from the changes in the hsv values (hue, saturation, value). This approach might result in part of the region of interest being removed along with the background. Also it is quite difficult to automate this process where the program implicitly detects the region of interest and detaches the remaining part. During the pre-processing stage of an image CLAHE contrasting algorithm is used to increase the contrast. This results in spots or color marks on the image which are not veins, to be enhanced as well. Therefore, we are trying to increase the contrast of only the vein pattern while the rest of the image remains as it is.
Experimental Setup and Implementation
This section is covered under three main parts: hardware design and implementation, Image processing, and interface design.
Hardware design and implementation
Near-Infrared Spectroscopy to identify veins and display on a screen.
Veins contain oxygenated hemoglobin-rich blood that almost completely absorbs light at near-infrared wavelengths (750 nm–950 nm) up to several millimeters. Using this phenomenon, we can illuminate the skin using infrared-emitting light sources within the specified spectrum and capture the images using an infrared-sensitive image sensor. By further processing of such acquired images, we can extract the vein pattern. We also display the live stream obtained from the camera in order to guide the phlebotomist. He will be shown the detected vein map of the puncture site. He will also be guided by the live stream and will not lose the normal vision on the puncture site by this mechanism. This can resolve many issues faced by venipuncture.
However, depending on the region, skin color, weight the effectiveness of the selected wavelength can vary. Therefore, our study is about coming up with the best wavelength combination and effective image processing algorithm to identify the vein map irrespective of the above conditions.
Initially, we got 3 light sources emitting at 3 different wavelengths. Namely 750nm, 850nm, and 950nm. Controlling the intensity of these light sources is not a concern at this stage. To verify the light sources that they emit such wavelengths we needed an infrared light spectrometer. However, such a device was not available to us at that moment. So we planned to build a spectrometer to do our study.
Optical spectrometer is an instrument used to measure properties of light over a specific portion of the electromagnetic spectrum, typically used in spectroscopic analysis to identify materials. The independent variable is usually the wavelength of the light or a unit directly proportional to the photon energy, such as reciprocal centimeters or electron volts, which has a reciprocal relationship to wavelength.
A monochromatic light beam that is incident on a grating gives rise to a transmitted beam and various diffracted beams, at angles that depend on the ratio between the distance between the lines of the grating and the wavelength of the light. So, if the light beam is composed of multiple wavelengths, the decomposition of the beam into its components is obtained.
The light with a longer wavelength is deflected to a larger angle with respect to the incident direction (angle of diffraction ) . For each wavelength more rows can be observed. The number of rows that are counted from the middle line, which is not skewed with respect to the incident beam and is taken as a reference , it is said “order” and is often denoted by the letter m.
The goals of the build were as follows:
- item Having at least 5 nm spectral resolution.
- item Covering the entire visible spectral region and the near-infrared spectral region.
- item Low cost and convenience to calibrate.
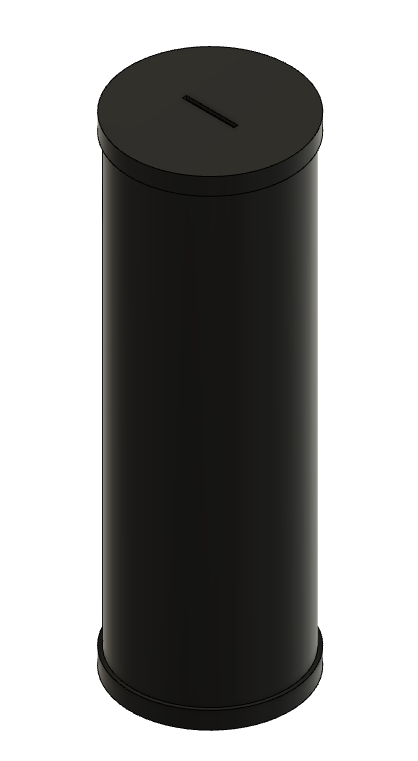
The initial prototype for the spectrometer was designed using CAD software with the required dimensions and built by using 3D printed parts and was designed using CAD software.
Initial prototype for the spectrometer
The modal overview is as follows.
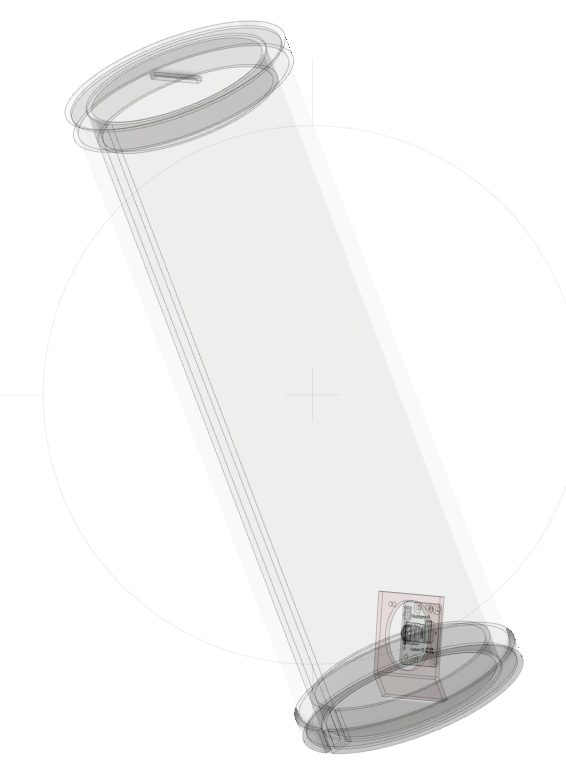
The key optical principle in a spectrometer is diffraction. The slit was constructed with thin sheets of aluminum with sharpened edges. This allows a very limited amount of light to the sensor as a large amount can overwhelm the sensor and lead to inaccurate readings. To collimate the light, a biconvex lens was kept at its focal length away from the slit. This will ensure the light will enter the diffraction grating in a parallel manner. The diffraction grating is really important in this setup. Initially, we were not able to get ahold of quality diffraction grating. So we carefully removed the diffraction material in the DVD disk and used it in our first attempt.
However, our first attempt was not successful because the DVD did not serve well as a true diffraction grating inside the first prototype. Moreover, a collimating biconvex lens was not included in the first prototype.
We were able to find high quality 1000 lines per mm grating from the Faculty of Science and rebuilt the spectrometer. Therefore, we redesigned the spectrometer with the true diffraction grating and a collimating lens fixed at its proper focal length. The second prototype proved to be much more accurate.
To analyze the light, we used a Logitech C270 image sensor (Web Camera) with its inbuilt IR Filter removed (In order to let the IR light enter the sensor). The software was an open-source software and to calibrate we used a Mercury Lamp which emits specific peak wavelengths at 4 different points and used 2 points to calibrate. The two points used for calibration were Mercury 2: 436 nm and Mercury 3: 546 nm.
After calibrating the spectrometer, we analyzed our two IR sources in a controlled environment to avoid unnecessary light entering the spectrometer. The first source used was had a wavelength of 950 nm. The analyzed result gave us a reading of 945 nm and it was satisfactory. The second source had a nominal wavelength of 850 nm and it was read as 840 nm. This was also acceptable since these light sources were not high-quality ones.
Initial prototype to capture images
The prototype was designed to be composed of the following components.
- Light source setup
- IR Sensitive Camera
- Single-Board computer
We designed the prototype to be able to hold 3 light sources at a time where each light source can be turned on and off. The light sources were powered with a 12V power supply which provides 5Amps on load. The single-board computer is a Raspberry Pi Model 3. Raspberry Pi is running a Lightweight version of Raspberry Pi OS which is a Debian-based operating system for Raspberry Pi. OpenCV was compiled and setup on the computer, in order to handle the image processing part of the study. The IR sensitive camera is a product from the same manufacturers of the Raspberry Pi, named NoIR camera which uses a Sony IMX219 image sensor with no inbuilt IR Filters. This is a CMOS sensor. However, CCD works best with Infrared imaging, but, at this point, we could not get ahold of a CCD Sensor.
The prototype is designed so as the height of the camera and light sources are manually adjustable so that we are able to adjust the focus and determine the best distance for proper illumination and capturing images. The camera comes with a fixed focal distance. However, it sits within the region we require.
The light sources can be turned on either individually or as a combination during the image acquiring procedure. Following figure displays the actual prototype with 2 IR light sources namely 940 nm and 850 nm. The images were taken using an IR sensitive camera to see the observe the functionality of IR sources.
https://user-images.githubusercontent.com/62101605/115156034-1441cc00-a0a0-11eb-9768-5ec665f267ee.png
Second prototype to detect and display veins
The second prototype consists of the following components.
- Light source setup
- IR Sensitive Camera
- Single-Board computer
- Display screen
As the light source, we used 48 LEDs emitting at wavelength of 940nm. We arranged IR LEDs in a circular array. This illumination setup uses a total power of 18W. The intensity of the LEDs is controlled by Pulse Width Modulation (PWM). We use the same camera we used in the initial prototype with an IR sensitive image sensor - SONY IMX219. A high-pass filter is used so that the radiation above 750 nm is let to pass through and those below that are cut off. image processing is done on a single board computer raspberry pi 3b which has a Quad Core 1.2GHz Broadcom BCM2837 64bit CPU with a 1GB ram. We use a 7 inch IPS LCD panel with a resolution of 1024x600 for the display of veins. It is powered by a set of li-ion cells with a capacity of 37Wh. Following figures give few different views of the second prototype.
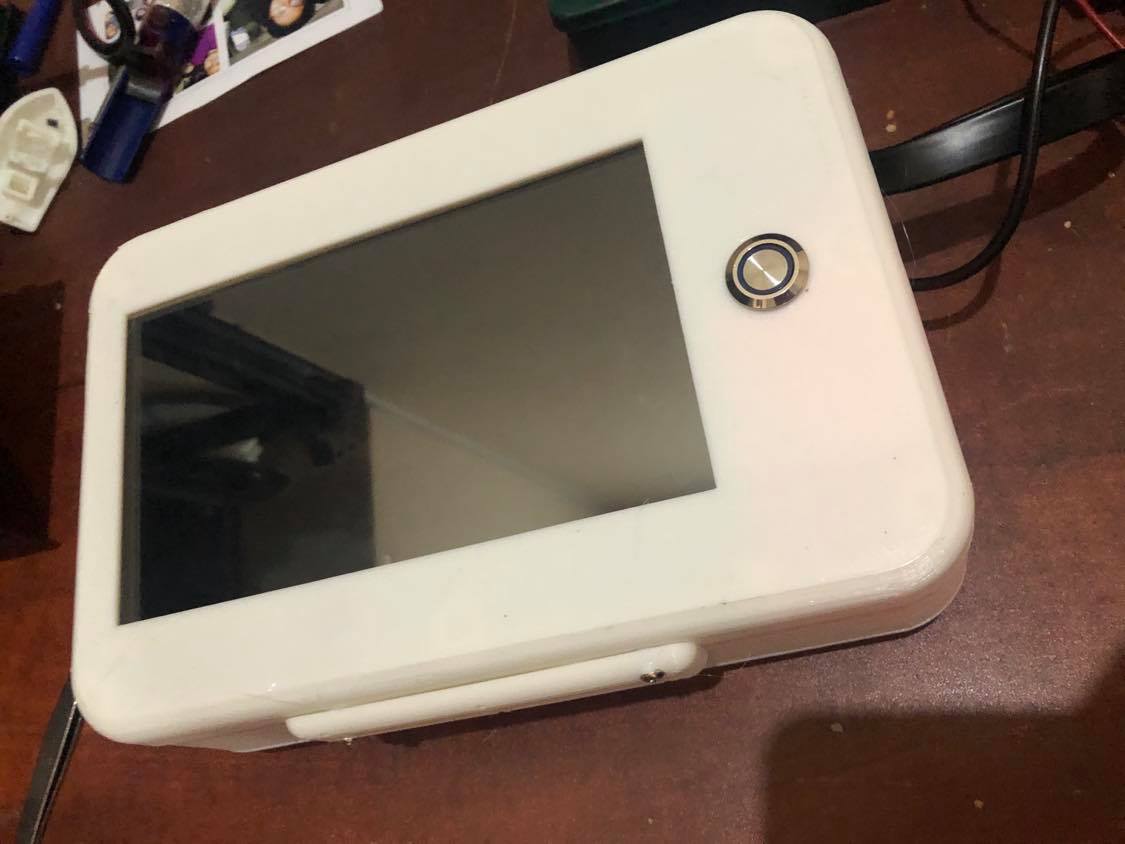
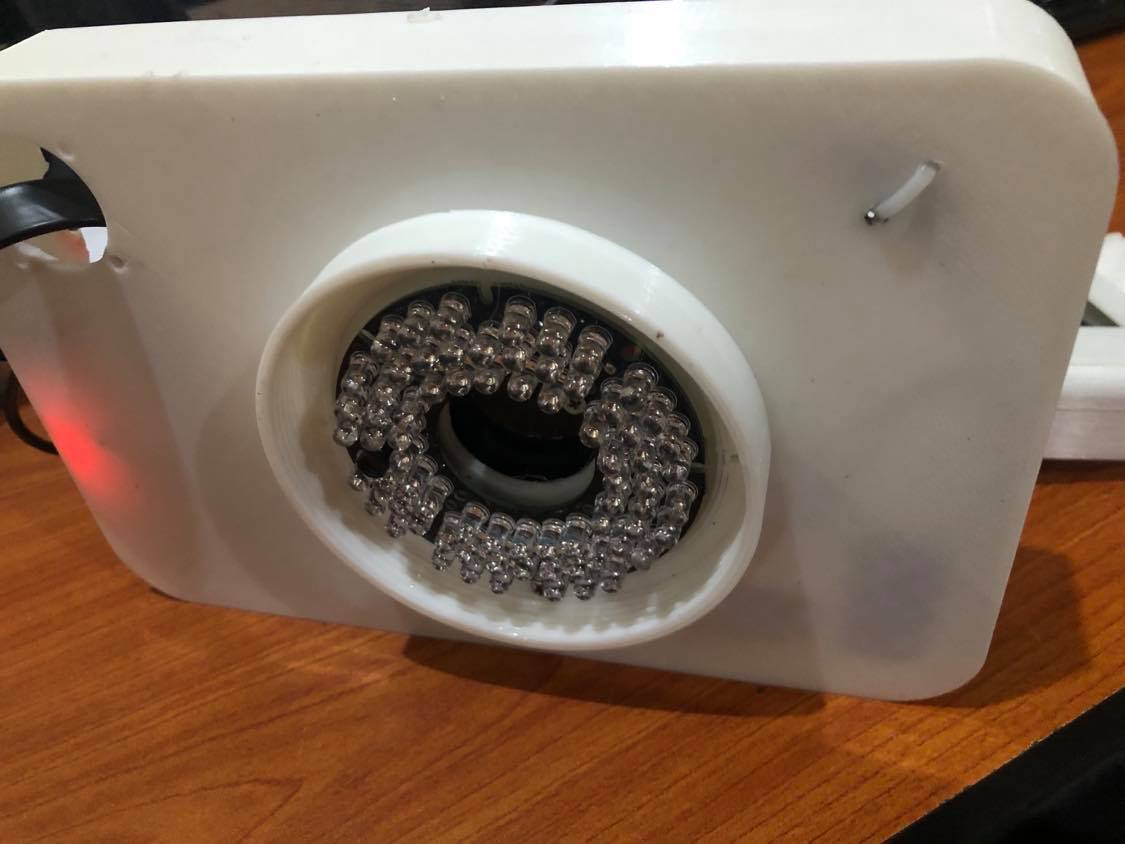
Final prototype
The final prototype was implemented with suggestions from the medical personnel and considering ease of use and accessibility. The image capturing module was separated from the previous inbuilt design to make it easier for accessing difficult and sensitive venipuncture locations.
Following figure shows an overall view of the final prototype including the image capturing module and display module.

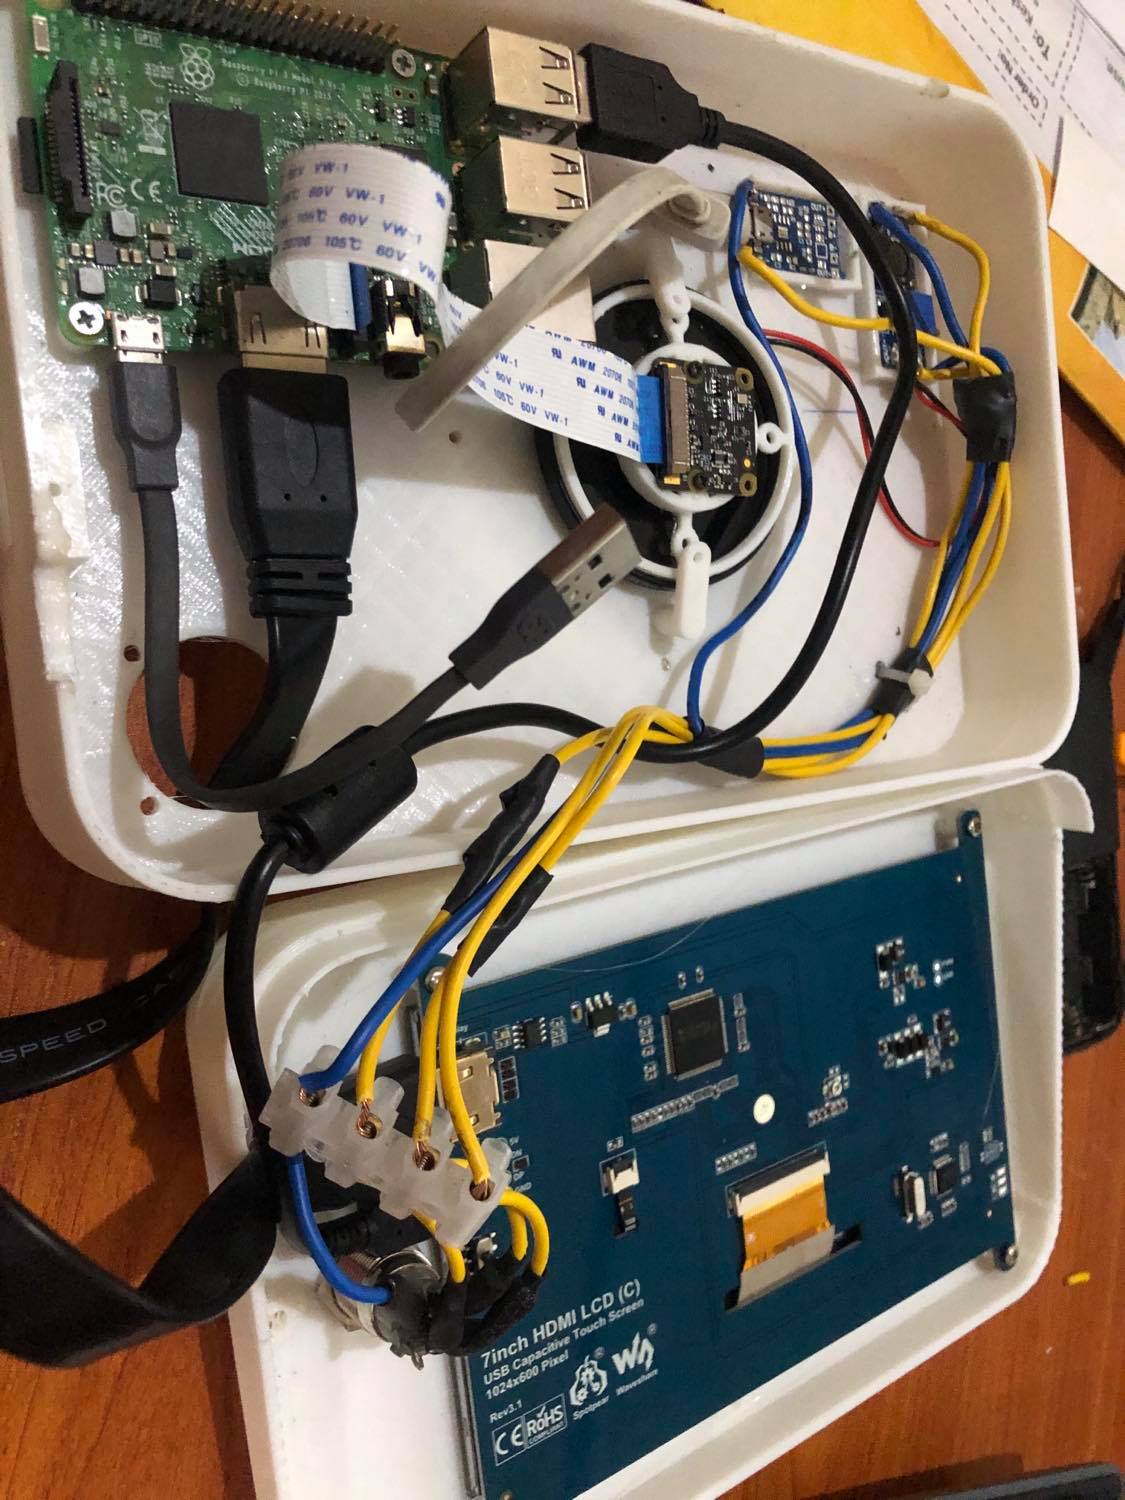
The final prototype consists of the following components and an updated IR source with higher intensity.
- IR light source
- IR Sensitive Camera
- Optical High Pass filter
- Battery System
- Single-Board computer
- Display screen
The IR source consists of 96 LEDs emitting infrared light at 850 nm with a total power of 18 Watts. If we compare it with the second prototype, it consists of 48 LEDs of 940 nm. After analyzing the intensity and determining the wavelength we decided to go with 96 LEDs of 850 nm.
Thefinal prototype can be seen in the pictures below.

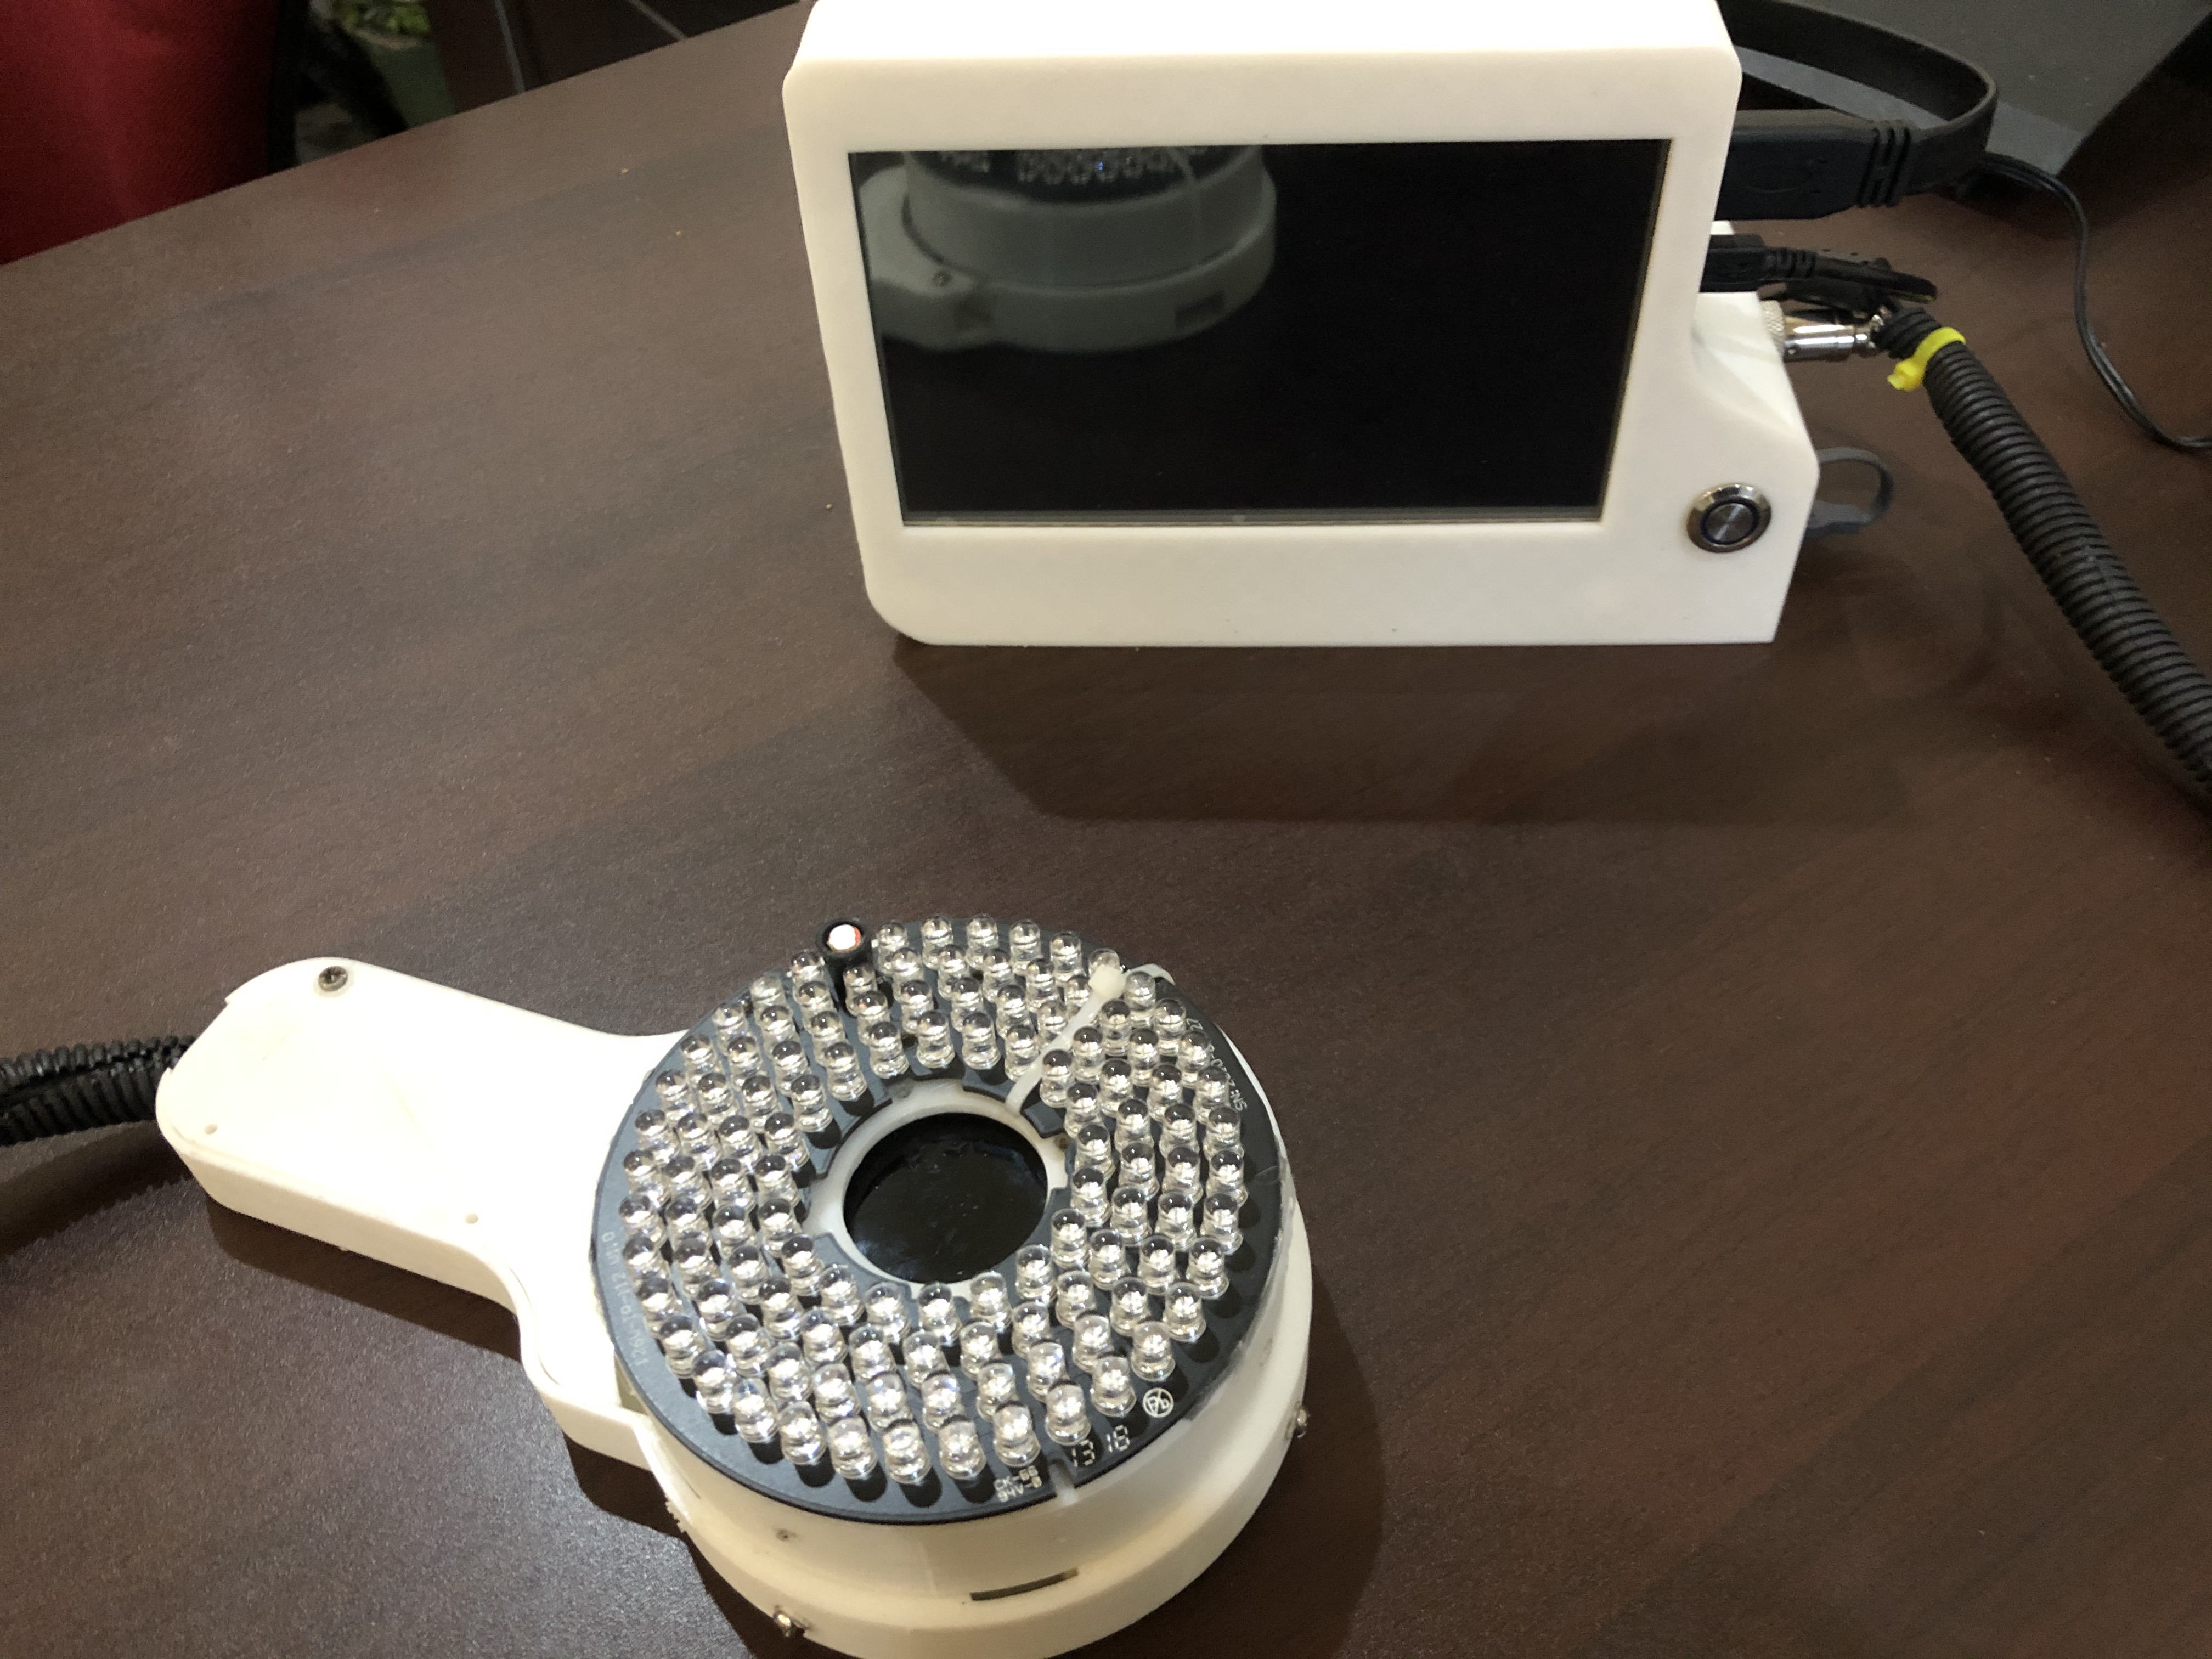
Image processing
Several image processing techniques are utilized to get the vein map as the final output, but they can be broadly categorized into 3 main parts as described in the methodology section. In this section, we will explore how each phase can be explored and implemented in a programming environment.
Background removal
This stage removes the background of a particular image and isolates only the region of interest. This is accomplished by considering the HSV (hue, saturation, value) values of the image and thereby create an upper and a lower matrix to form the image free without its background. The values of the two matrices are found by using a track bar that executes in the runtime. Original image with the track bar is shown below.
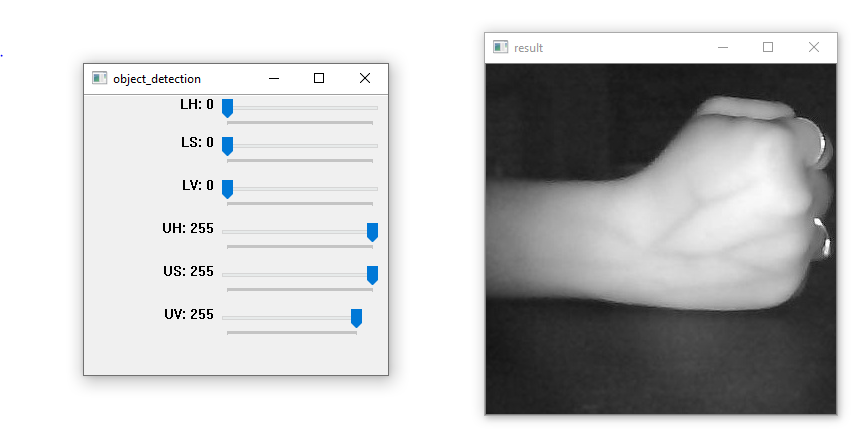
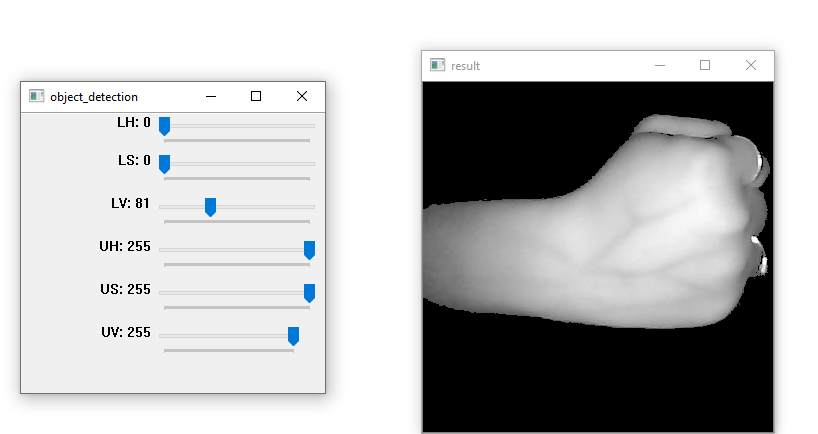
Image after background elimination is as follows —
Preprocessing
The primary constituents that we consider as preprocessing for our application are contrasting / equalization and smoothening. The sequence in which these techniques are implemented is: contrasting first, then morphological transformation, followed by smoothening. Contrasting is implemented using two widely used techniques - Histogram equalization and CLAHE.
Contrasting using Histogram equalization
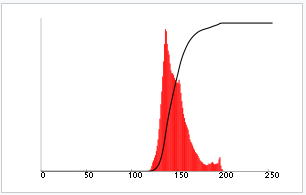
A histogram is a graphical representation of the intensity distribution of an image. In simple terms, it represents the number of pixels for each intensity value considered. Histogram Equalization is a computer image processing technique used to improve contrast in images. It accomplishes this by effectively spreading out the most frequent intensity values, i.e. stretching out the intensity range of the image. This method usually increases the global contrast of images when its user data is represented by close contrast values. This allows for areas of lower local contrast to gain a higher contrast. Following image shows the equalized image compared with the original image.
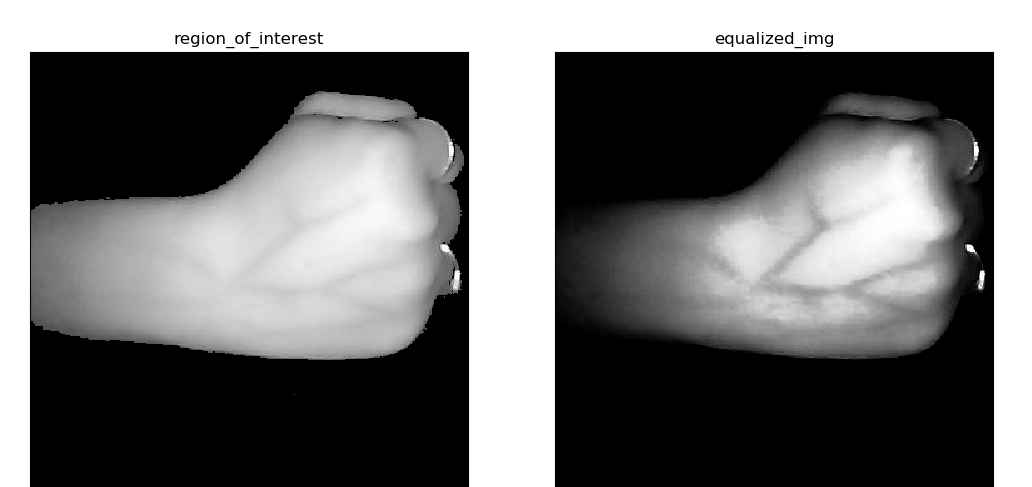
We can observe that the vein pattern of the hand is enhanced in the second image. If we plot a histogram for each of the images the outputs would be as follows.
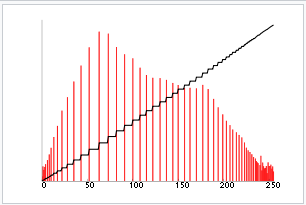
Contrasting using CLAHE (Contrast Limited Adaptive Histogram Equalization)
CLAHE is an improvement on histogram equalization. It limits the contrast amplification to reduce amplified noise by distributing that part of the histogram that exceeds the clip limit equally across all histograms. In general, there are some features in the near-infrared superficial vein images such as high noise and low contrast. CLAHE comes in handy for a situation where the edges of veins in the image are blurred and the vascular lines are not obvious. We can use the CLAHE algorithm iteratively even though it is not ideal in every situation.
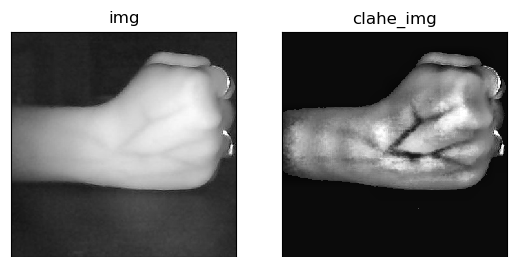
We can see that the image on which CLAHE is done provides more contrast than the equalized image. The veins appear to be highlighted better. The problem is that the veins seem to be a little bit thicker than that in the original image. These are rectified in the latter stages of preprocessing when morphing and smoothening are done.
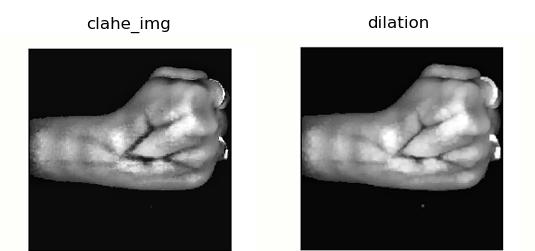
Morphological transformation
Under morphological transformation, we have only used “dilation” and “closing” so far. Additionally, there are few others namely, “closing”, “opening”, and “top-hat gradients”. Opening and closing were used to make the contrasted image from CLAHE appear closer to the original image in terms of the size of the veins.
Since the CLAHE algorithm appears to thicken the veins, we need to narrow them down. The technique that is proved to be most useful in this case is “dilation”. The below images show the input (CLAHE image of the vein pattern) to the dilation method and output generated from it. Following figure depicts the comparison of the above approach and for ease of comparison, the same image is used.
Smoothening
This is the final stage of image preprocessing. As we saw previously the dilated CLAHE image still contains a small amount of noise and is slightly pixelated. We’ve tried out 3 types of blurring (smoothening) techniques – Gaussian Blur, Median Blur, and Bilateral Filtering. We saw that all the operations smoothen the image while maintaining the same level of detail. Also, we observed that bilateral filtering provides the most smoothened image. Therefore, we opted to go for bilateral filtering. Following figure depicts the comparison of these blurring techniques along with the dilated CLAHE image.
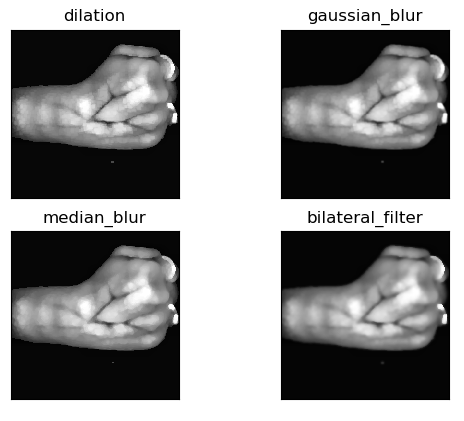
We can see that all the operations smoothen the image while maintaining the same level of detail. Also, we see that bilateral filtering provides the most smoothened image. Therefore, we opted to go for bilateral filtering
Algorithm Development
This is the most complicated part of image processing that we have currently encountered. The entire algorithm can be summarized into 8 steps which were stated previously.
The first 4 steps were discussed under background removal and preprocessing. The next involves a procedure called clustering. It is an Unsupervised Machine Learning technique which we can apply to find new patterns in our data. What’s interesting about this algorithm is that we can also use it for image processing tasks as well. In the same manner as with other types of data, we can find pixel patterns in our images that will allow us to process them in a faster and more efficient way. Though there are many clustering methods, we used K-means clustering which is quite straightforward and efficient. How this algorithm works is explained below.
K-Means is a data clustering algorithm that tries to assign every data point in a data set to exactly one of K possible clusters which is defined according to the users requirement. The main idea here is that the algorithm tries to build the clusters in such way that two data points from the same cluster are as similar as possible, while two data points from two different clusters are as different as possible. The algorithm will iterate through the data set many times and we need to find a proper condition for it to stop.
An important notion related to Kmeans is the term “centeroid”. The centroid of a cluster is the mean value of all the values present in that cluster. The algorithm operates in a way that it makes sure that the sum of squared distance between the data points in a cluster and the centroid of that cluster is minimum. The centroid of the cluster is the mean value of all the values in the cluster. To elaborate even further the algorithm can be broken down into few basic steps. They are as follows.
- Assign the K number of clusters (this can be found using the elbow method) \item Shuffle the data and randomly assign each data point to one of the K clusters and assign initial random centroids.
- Calculate the squared sum between each data point and all centroids.
- Reassign each data point to the closest centroid based on the computation for step 3.
- Reassign the centroid by calculating the mean value for every cluster.
- Repeat steps 3, 4, 5 until we no longer have to change anything in the clusters.
In our application we use K-means clustering to group the pixels in the image so that more pixels with similar colors are in the same cluster, while pixels with different colors are placed in different clusters. Ultimately since the veins belong to a particular color range, this enables us to separate the pixels that belong to veins as a collection from the rest of the image. We tested the K-means algorithm on the smoothened image using different number of clusters on different images to determine the optimum value. The results are shown below in the figure.
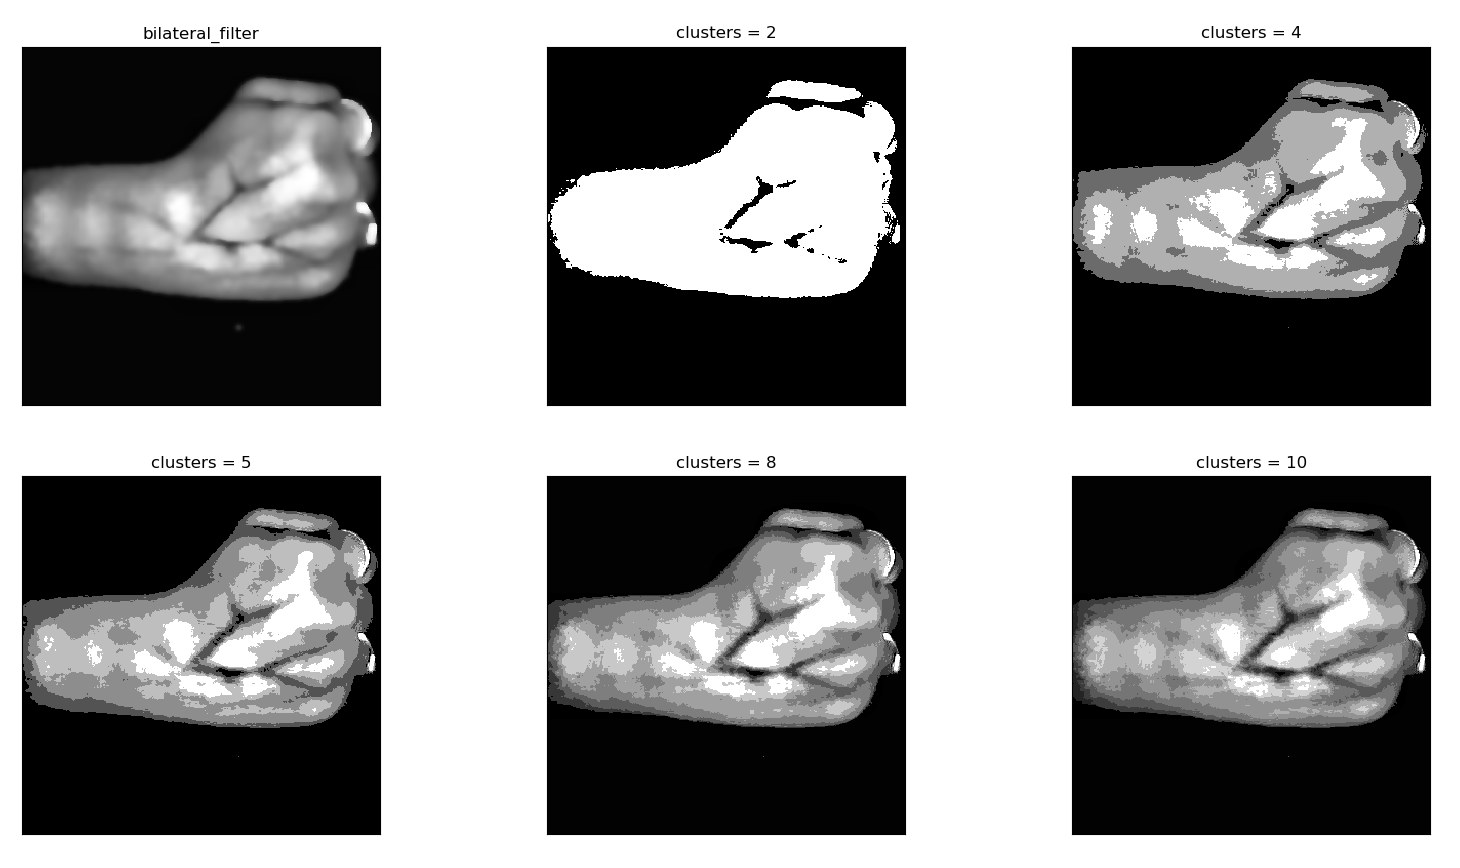
We saw that when the number of clusters increase, the image more and more similar to the original image. Since we need to separate the veins from the rest, resorting to small number of clusters seems ideal but it must not be too small because if that is the case, it could end up eliminating part of the veins that are slightly less visible. For example, here we can see a clear distinction between the veins and the rest when the number of clusters = 2. But we see that part of the veins which have low intensity have disappeared since the program interpolates those pixels to the cluster which holds the light coloured pixels. The output when the number of clusters = 5 provides a good balance and seems to be the best result.
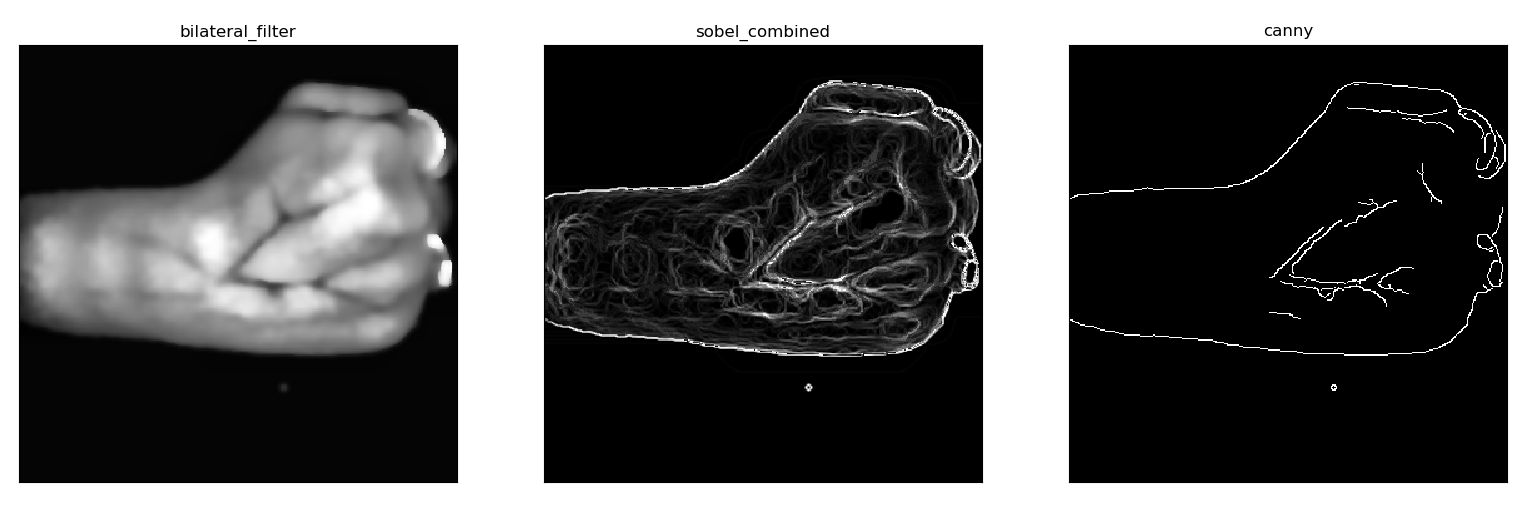
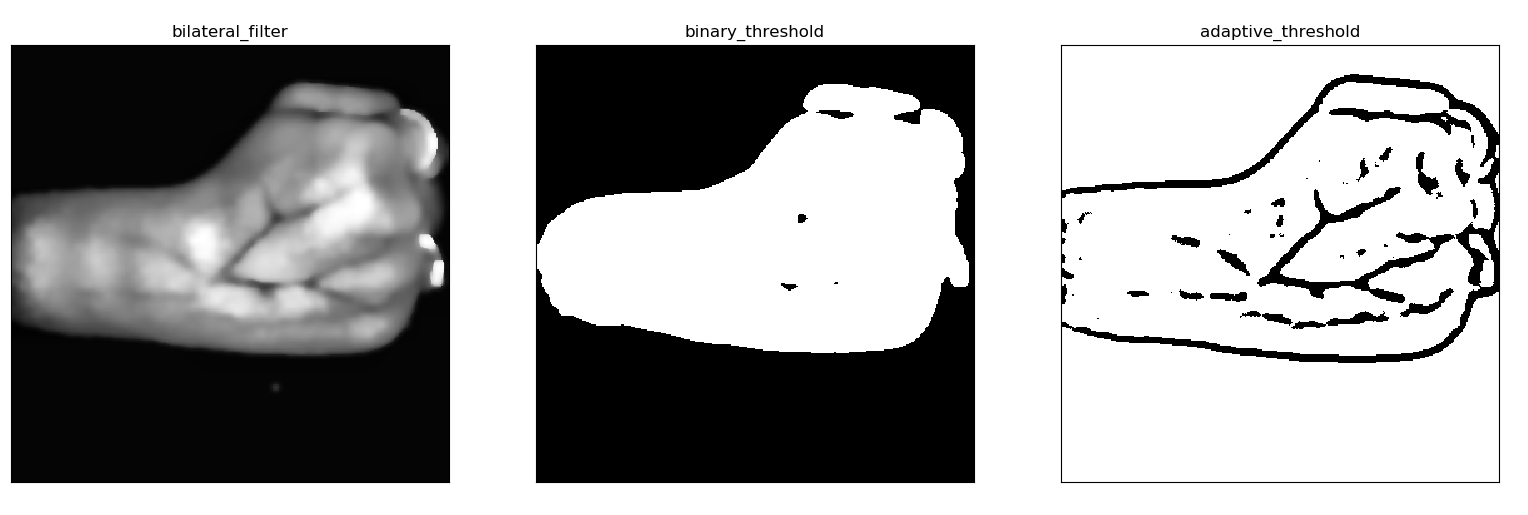
In the sixth step, we perform edge detection on the clustered image to obtain the edges of the vein patterns in the segmented image. Open CV offers several edge detection methods such as laplacian gradient, Sobel combined, and Canny edge detection. Laplacian gradient method proved to be ineffective as it showed no visible edges of veins but only managed to show the edge along with the hand (outline of the hand). Sobel combined method was able to separate the veins but also showed a lot of unwanted detail in the process. Canny edge detection was satisfactory as well. But it wasn’t capable of showing all the edges of the visible vein pattern but was able to provide a portion of it. The following figure depicts the comparison between the smoothened image, Sobel combined, and Canny edge detection.
The next step of the algorithms uses thresholding. In conventional binary thresholding, each pixel of the image is considered and based on a threshold value the color of the pixel is converted to either black or white. When considering the colors of the pixel, the RGB values are the key aspects. In a grayscale image, the RGB values are scaled down to one particular value, so the thresholding algorithm checks that value with the threshold and based on that decide which to color to assign. For example, if the threshold is 127, then every pixel that has the value below 127 is converted to black, and the rest become white.
But this approach didn’t yield good results, and therefore we had to resort to a more refined method of thresholding named adaptive thresholding. Here instead of one global threshold value, the function splits the image into segments of equal size, and each segment assigns a threshold value depending on the pixel color values which belong to that particular segment. This provides much better results as shown in the figure below.
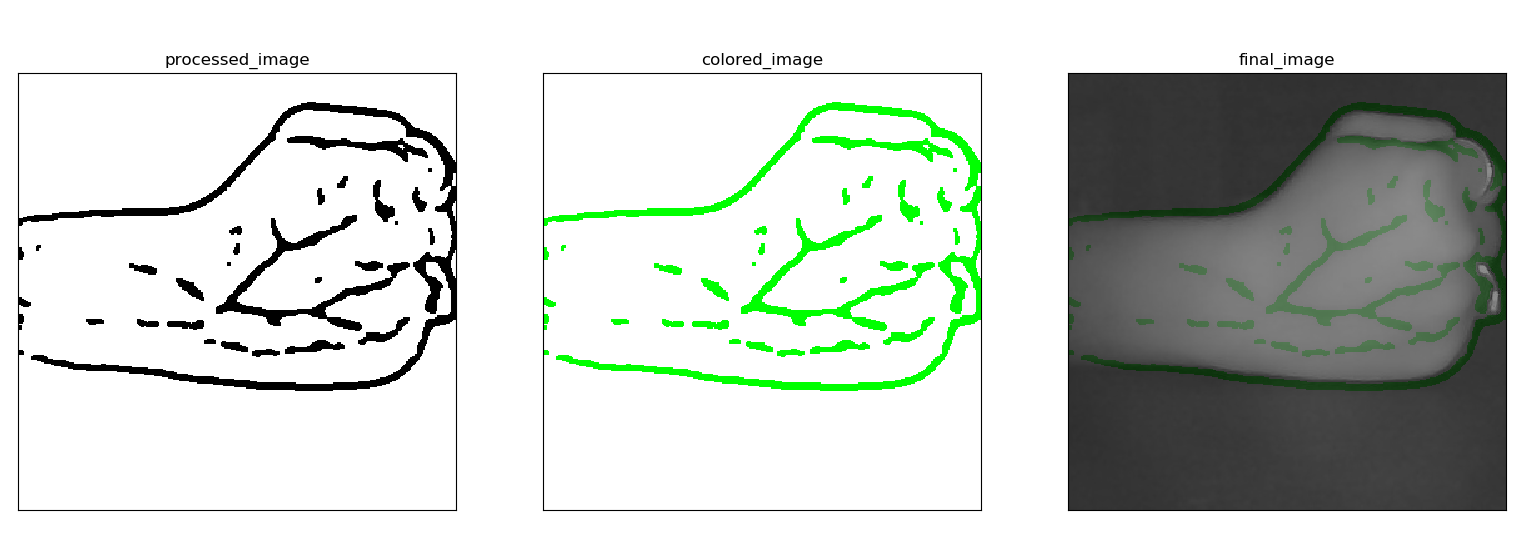
The final step is the coloring process. The processed image shows the vein patterns in black whereas the surrounding features are shown in white. This makes it possible to color only the veins by changing the RGB values of the pixels that are colored in black. After the colored image has been obtained it is then overlayed on top of the original image to form the final output as shown below.
This algorithm works on a satisfactory level, but for some captured images the results were not as good. Therefore, we are working on how to improve the algorithm, what changes we need to make, how to optimize in terms of computational speed, and to increase the overall accuracy for any type of image that includes vein patterns.
Algorithm optimization using multi-threading
Multiple threads are used for parallel processing of the frame. The raspberry pi has 4 cores, and so we created 3 separate threads which are executed in parallel. The parent thread captures a frame, and displays the final output in the user interface. The 3 threads process 3 individual frame segments allowing them to be processed simultaneously without any dependency. The parent process splits the captured frame into 3 segments and feeds them so that each thread has only 1 segment to process at a given instance. Then the parent thread waits for all 3 threads to return their respective frames which have undergone the processing steps specified by the algorithm. Once all the threads have returned, the parent process continues from where it had paused. The frames are joined together in their original order to compose the output frame which is displayed in the user interface. An important thing to note is that all of this (from capturing a frame, dissecting it to segments, processing each segment in each thread, returning them to main thread for display) takes place real time. With this approach the latency that was present earlier without threads, is substantially reduced even when there is a lot of movement.
Interface design
After designing the algorithm the next step is to actually create a user interface to display the processed output to the user on a real time basis. This is still in a development stage, but the process occurs according to two phases.
- Designing the interface to display still images.
- Enable to interface to display a processed live stream.
Designing the interface to display still images
Initially the GUI was designed to be able to show still images while providing few other features like rotation, zooming, transition from base image to processed image and then to the colored image, as well as full screen viewing. These features are shown in the figure below.
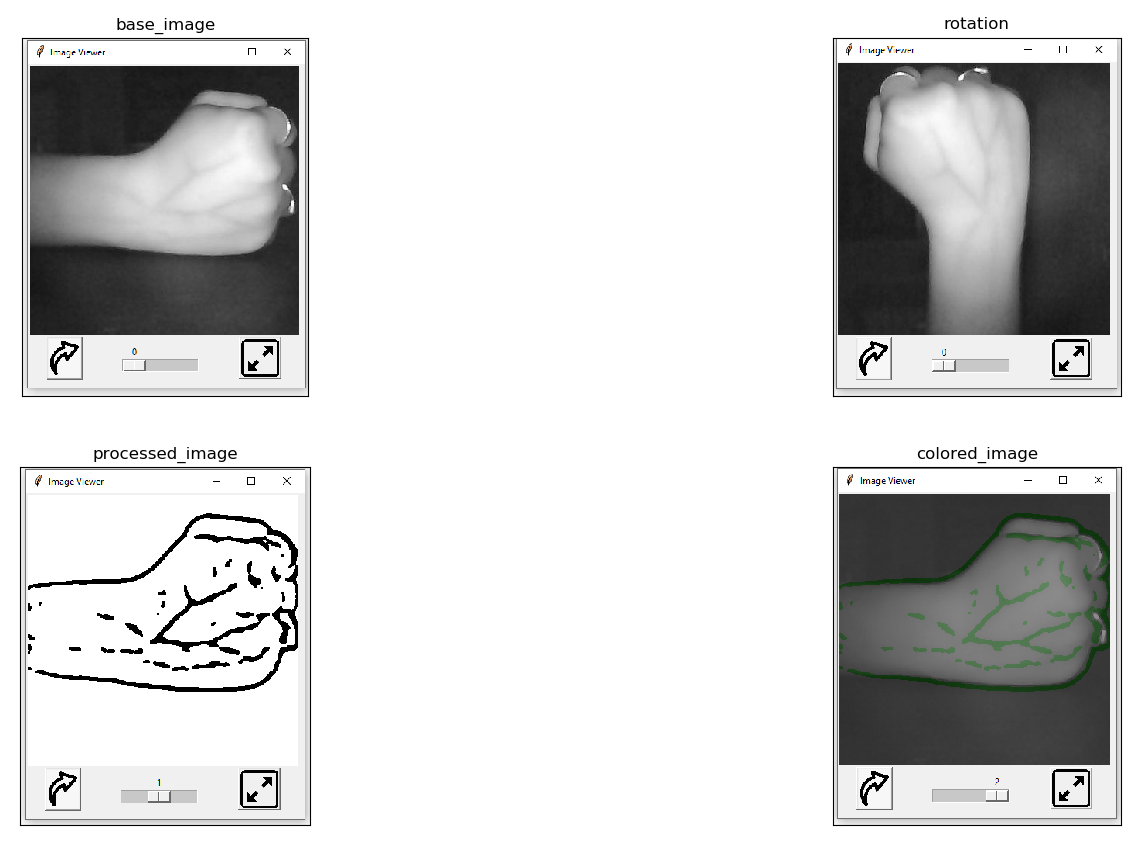
The python tkinter package along with openCV is used to create the widgets and the overall functionality of the graphical user interface.
Configuring the interface to display a processed live stream
This is the most significant phase of the GUI. We were able to get a live stream up on the GUI and displaying the processed stream with the use of multi-threading. The latency issues which we faced previously were resolved and we are able to produce a processed live stream that is crisp and clear. The veins are displayed vividly and the contrast difference and the smoothness enables the user to identify the veins precisely.
Results and Analysis
Testing the light intensities
As mentioned before we used 2 separate NIR LED arrays corresponding to two intensities(18W and 60W) as the light sources and obtained their outputs. The base images and the outputs gained from each light source are shown in the figures below.
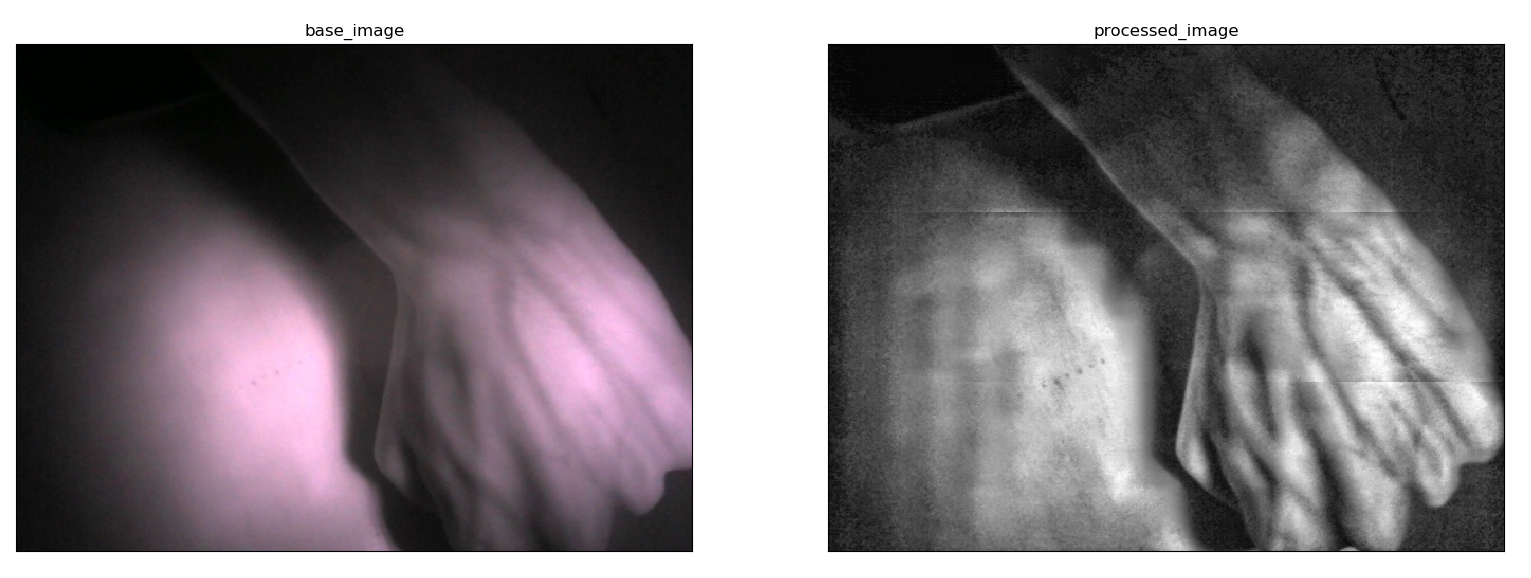
The output obtained from the 18 watts source is quite accurate at visualizing the veins even managing to show very thin subcutaneous veins. The contrast is high and the image is smooth as well. We’ve obtained a lot of images using this lighting source and most of them were able to display clearly visible vein patterns. When looking at the output of the 60 watts LED source we can observe the vein patterns up to some extent. But the very thin veins are barely visible. Also the image has a glare which is caused by the light reflecting from the tissue. This was the case for most of the images that we took. The output from the 18 watts LEDs gave the better results in terms of accuracy, contrast and clarity.
If the subject has a lot of body fat then the light emitted from the 18 watts source may not be able to penetrate through the subcutaneous fat and reach the underlying veins. This may cause veins in some regions to not be visible in the captured image. We hoped that the 60 watts light source would provide sufficient penetration in order pass through the layer of fat within the Hypodermis and resolve this issue. But the results were not as we expected. Even though the intensity is high, it was not enough to penetrate the tissue and the fat probably due to a large portion of the light being deflected from the epidermis and dermis. Thus we observed that having a higher intensity does not guarantee better results. In fact between the 2 sources, the 18 watts light source proved to be the better one. For further analysis lets take a look at the histograms generated for the processed images corresponding to each intensity.
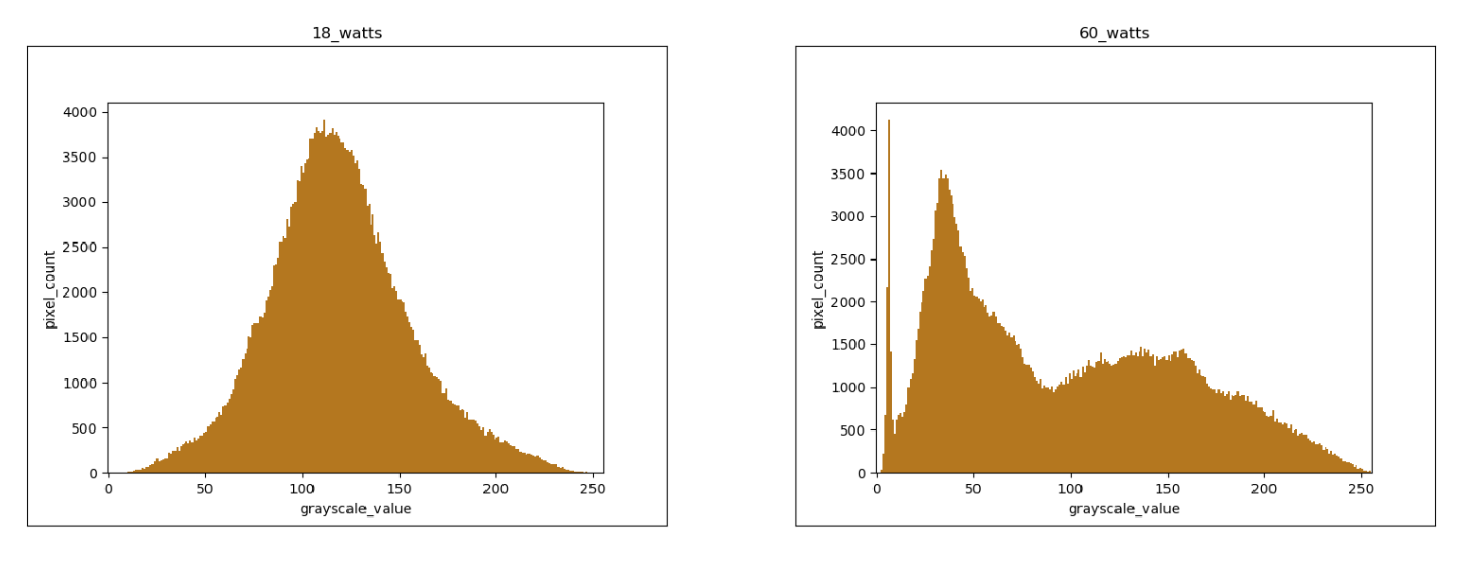
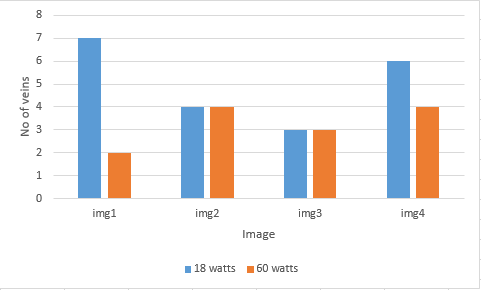
The above figure shows the differences between the two outputs. The histogram of the low intensity output is uniformly distributed unlike the histogram of the high intensity output. There are spikes in histogram of the high intensity output for some gray scale values. This indicates the presence of color spots in certain regions. If we look at corresponding image, we can see patches of white in the hand and dark patches in the background. To compare the two intensities even further, we’ve taken set of images and took the count of the clearly visible veins for a set of images obtained using both intensities. The results are shown in the figure below.
Testing the algorithm
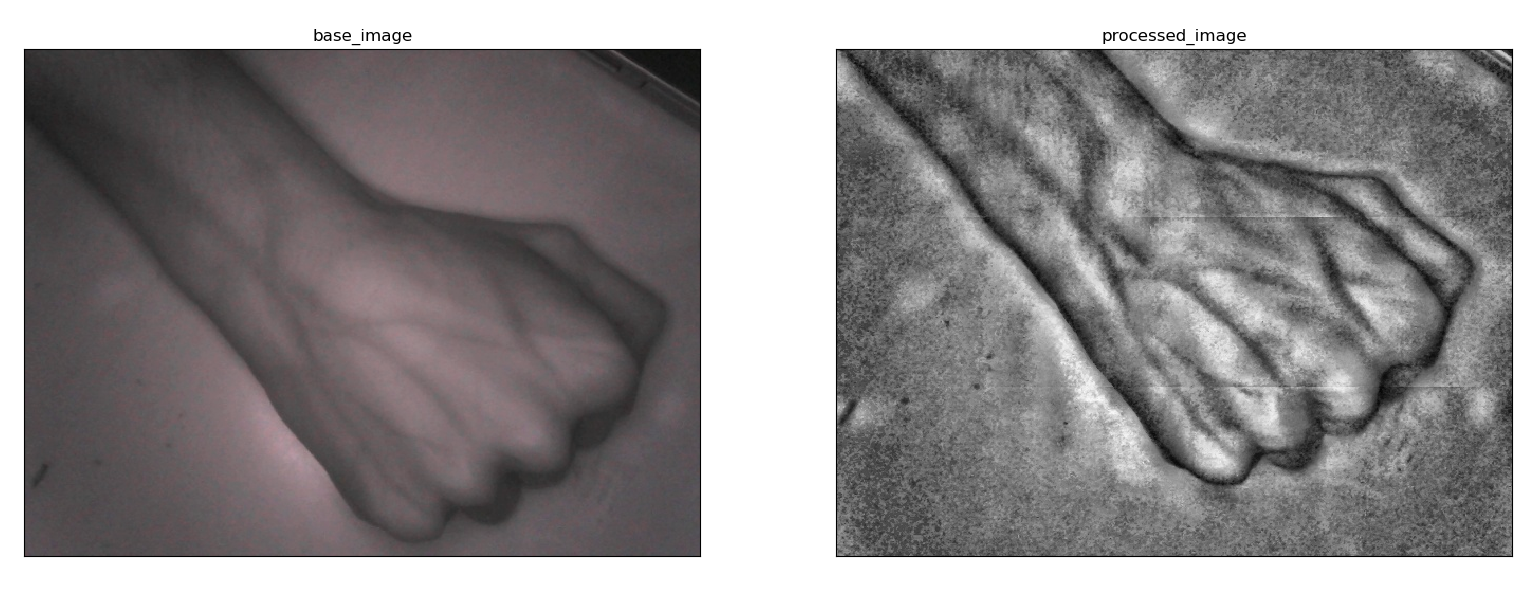
We tested several sample images that were captured by the prototype we built, with the algorithm that we developed and got their outputs. Shown below are sets of images pertaining to different regions of the hand. Each figure illustrates the outputs of each step in the algorithm starting from the raw base image to the final processed image.

Looking at each set we can see that the final image highlights the veins which are not so clearly visible in the raw image. An issue that can be noted here is background elimination. For some images, the background is properly eliminated, but for some, the entire background is not eliminated. Also in the final image, we see some dark spots which are not veins. This is due to the contrasting effect and noise created by the CLAHE algorithm. Also, the algorithm falls short when detecting narrow veins but only gives a good depiction of the larger and more prominent veins.
Histogram analysis is a good method of identifying how the colors of an image are distributed based on their RGB values. We want the distribution to have concentrated clusters rather than a even distribution which makes is difficult to differentiate between colors. The following figure shows the histograms throughout each processing stage of the base image.
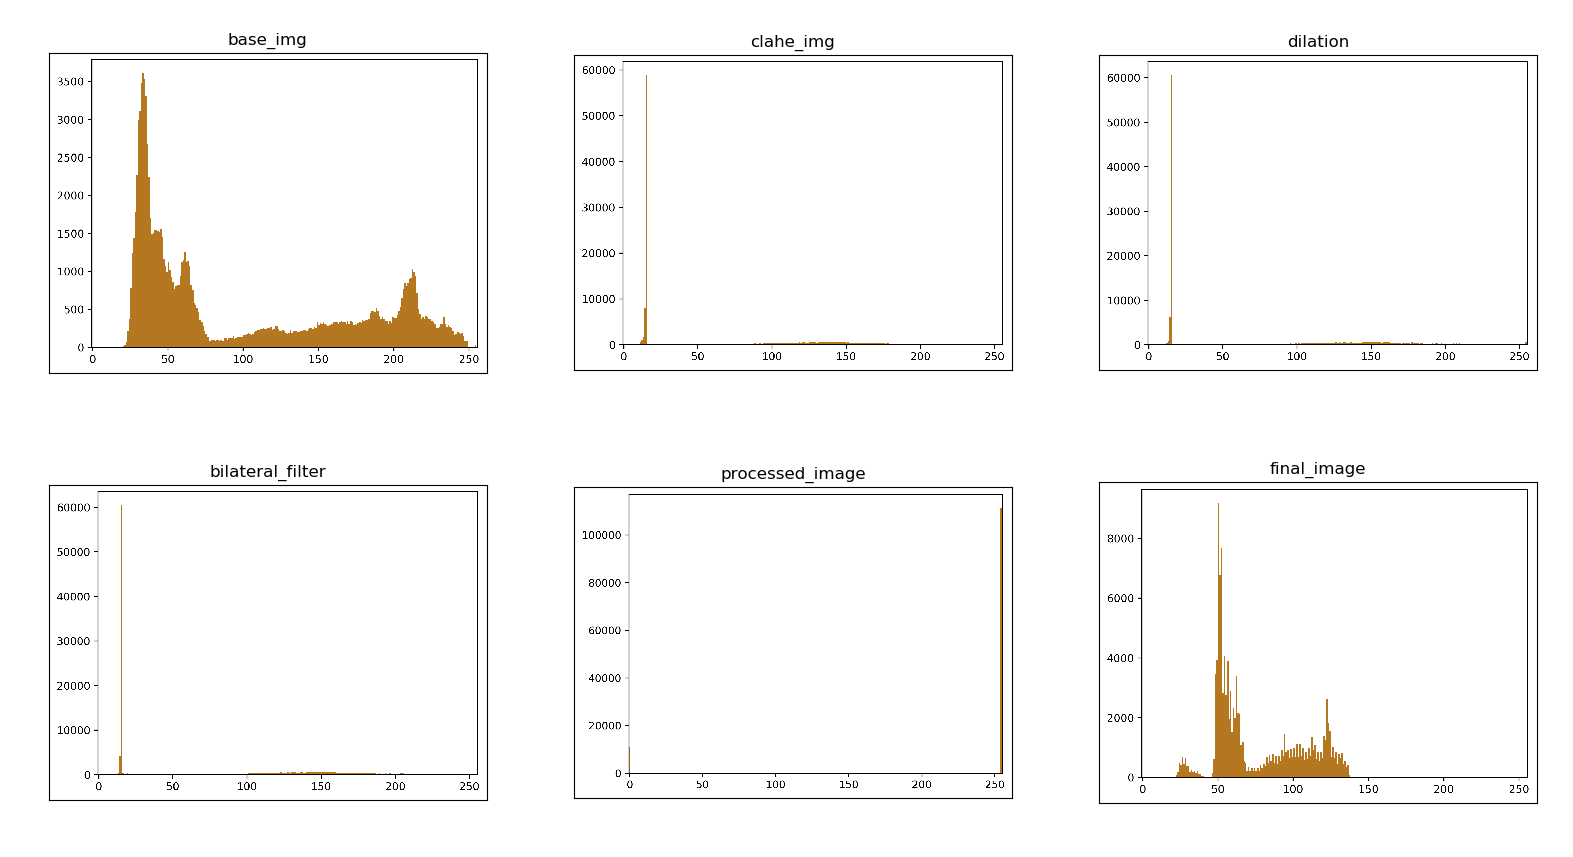
The most recent addition to the image processing algorithm is K-means clustering, which was discussed in length in the previous chapter. In this case, the number of peaks in the histogram indicates the number different clusters. Therefore, all of the pixels fall under one of the peaks which means all the pixels pertaining to veins fall under one peak/cluster.
When the number of clusters = 2, we can assume from the histogram that the pixels that form veins fall under the lower cluster () whereas the rest fall into the upper cluster. While this is convenient it doesn’t give the best result as some of lightly colored veins end up in the upper cluster and so some of the veins will not be present in the final image. When the number of clusters are high (8, 10), the image becomes too detailed, with many contrasting colors and if we look closely at the histograms the peaks located quite close to one another. This creates the issue of multiple clusters having similar colors. This is not ideal as we need the cluster which contains pixels of the veins to be separated from the rest. The ideal situation is when one cluster (to which the veins belong) is further as possible from the rest and the number of clusters need to be moderate. Hence we came to the conclusion that the amount of clusters to use for a given image, is a number between 4 to 6.
Performance testing after multi-threading
As mentioned under implementation the addition of multiple threads to achieve parallel processing of a frame increases the performance of the algorithm significantly. To explain the improvement we’ve obtained the processing times of frames in both (single threaded and multi threaded) implementations.
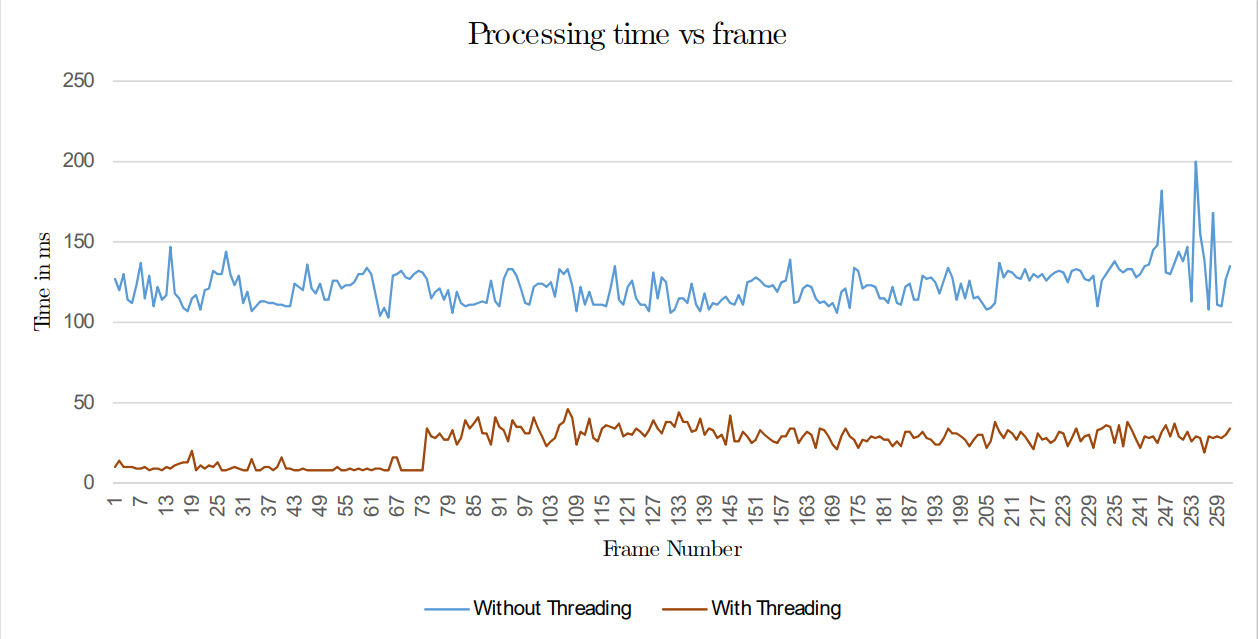
There is a clear difference between the processing times of the two methods. Based on these values, the mean processing time for a frame while using multiple threads is around 27ms (37FPS) having a clear margin over the mean time of the basic implementation which is around 130ms (8FPS). It is apparent that the multi-threaded application is almost 5 times faster that the basic one. This made a huge difference in the overall delivery of the output and enhanced the performance of the algorithm substantially. If the number of cores in the microprocessor had been larger, then the results would be even greater.
Video demonstration can be seen below.

Conclusion and Future Work
We have created a prototype for image capturing and perform preprocessing on the image.We have constructed an algorithm to obtain an output that shows the vein patterns and have optimized the algorithm to provide a clearer and more accurate depiction of the vein map. Considering the hardware implementation, we have developed a prototype by embedding the camera module, near-infrared light sources, single-board computer, and the display screen. The device is ready for clinical testing that unfortunately could not be completed due to the Ethical clearance process that took longer than expected given the pandemic situation of the country.
In the future, when the external parties permit, we plan to carry out the planned clinical testing and evaluation and thereby further improve the algorithms and fine-tune the device according to the feedback we get.
We also will extend the research further, to identify Peripheral Vascular Diseases (PVD) based on the data collected through clinical trials, in the future.
Publications
- Semester 7 report
- Semester 7 slides
- Semester 8 report
- Semester 8 slides
- Author 1, Author 2 and Author 3 “Research paper title” (2021). PDF.