
Intoduction
Road accidents are ever increasing in number. It has been reported that the average death rate due to accidents on the road is 6 people a day. It is also noted that over 1000 road accidents happen in a week. Although policemen are on the look for those who drive recklessly and there is a heavy fining system for road traffic related incidents, we see that these existing solutions prove to be ineffective.
Another problem with the existing solution is that most drivers obey rules only when they see an official (policeman) on the road. This most definitely does not and will not solve the problems we face on the road.
"Cop Mate" is a system we propose as a solution. It is a hybrid system that will keep track of the driving of a vehicle which will be mounted onto a vehicle. The hardware will monitor a vehicle and detect the crossing of road lines. When a line is crossed the system will measure the distance from that vehicle to an incoming vehicle and calculate how severe the road rule breaking was. All these sensed details will be used to determine the severity of the vehicle’s road-lines based road rule breakage.
The details we gather will then be made available to the use of the motor traffic department/ police for further analysis of drivers and having them face consequences accordingly.
For more detailed information, the application will allow the users to search breakings district wise and analyze where the most breakings occur. In addition to a district based filter, they will also be able to search breakings per vehicle, to be used as proof in case a driver ends up having to pay a fine.
Features
Analyse the road rule breakages of a day
Check the analysis of the road rule breakage of all the vehicles on a particular date
Analyse the road rule breakage of a particular vehicle
Check the analysis of the road rule breakage of a particular vehicle throughout the time
Analyse the road rule breakage according to the line type
Check the analysis of the road rule breakage of a particular line seperately
Analyse the road rule breakage according to the location
Check the severity of the road rule breakages in a map
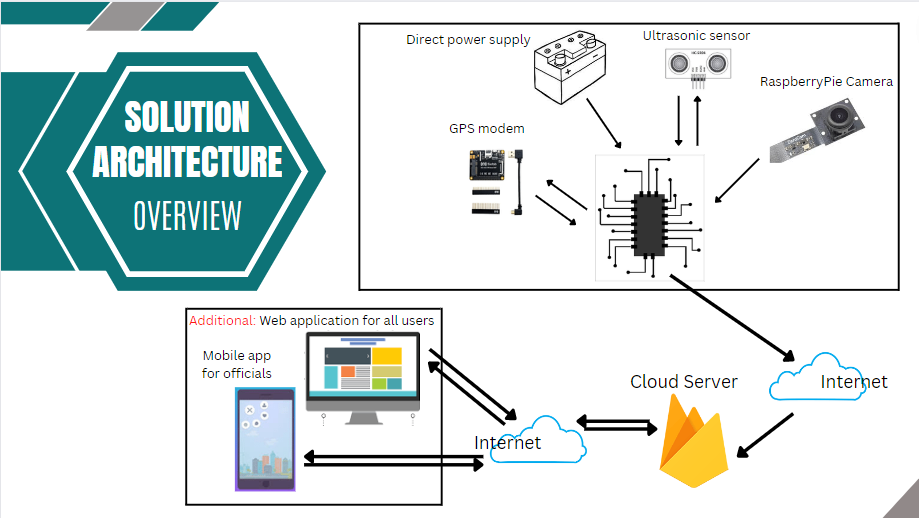
Solution Architecture
In the hardware node we get the video, distance and GPS location by the peripherals connected to the microcontroller.
These information will be then sent to the cloud server via the internet.
And the analized data will be sent to the front end via internet. The primary users; police officers will be able to access those data by login to our software application.
Data and Control Flow
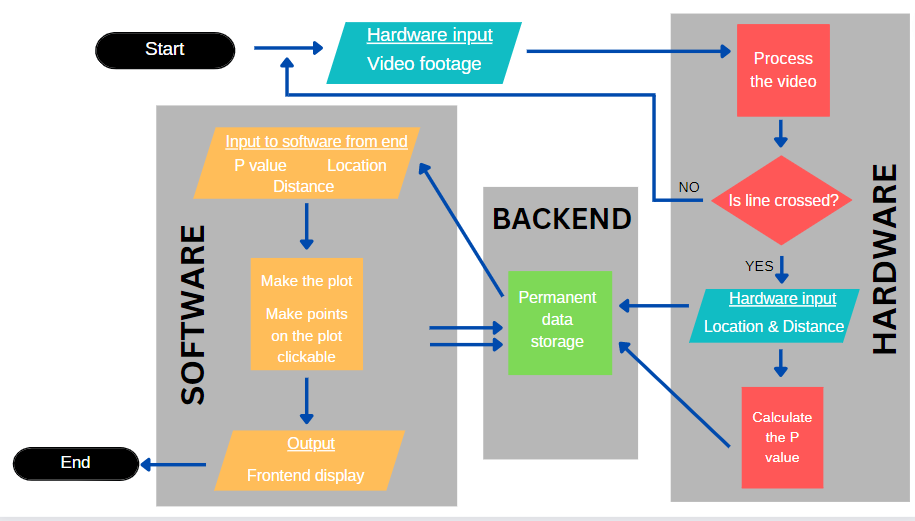
The camera module keep getting the video footage and process it. The other peripherals (sensors) connected to the microcontroller will get the measurements such as the distance to the overhead vehicle, location only when a line is detected.
Then a value is calculated according to the severity of the breakage. These information will be then sent to the database via internet. In the backend we will analyse those data and sent them to the frontend.
Finally, in our application, necessary details will be displayed for the users in forms of plots and graphs.
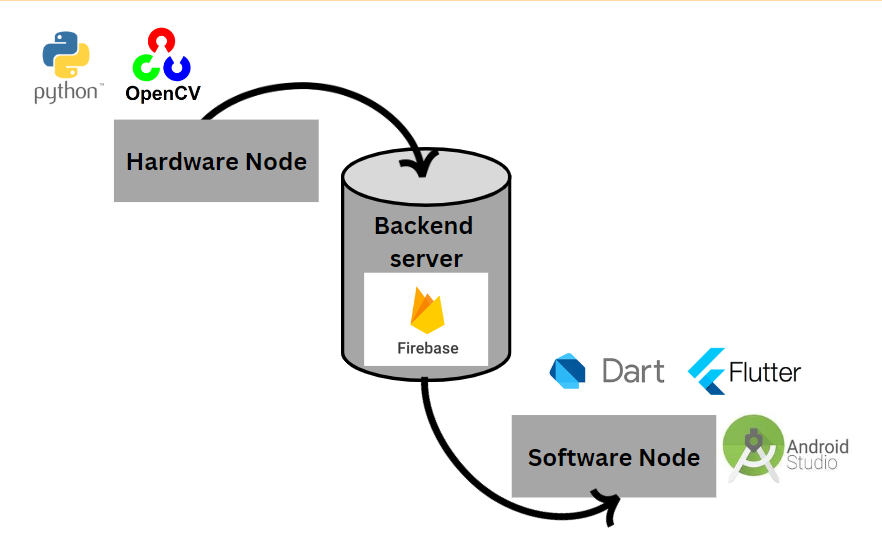
Technology Stack
We identify the proposed solution in a three-node design architecture. We have a hardware node, the backend, and then the frontend application.
Understanding the need for data storing security, security of data transmission and accurate measurement taking by the hardware, we decided on using these tools and technologies to make our solution work at its best.
Therefore, in the Hardware node we used OpneCV to do the video processing part.
We used Firebase as our backend server because it provides a variety of tools and services to help develop quality apps and grow the user base. We used Firestore database as our database to store, sync and query data for our mobile application.
In the Software node we used Flutter as our frontend development environment. Flutter uses the Dart programming language and is built on top of the Flutter engine.
Circuit Diagram
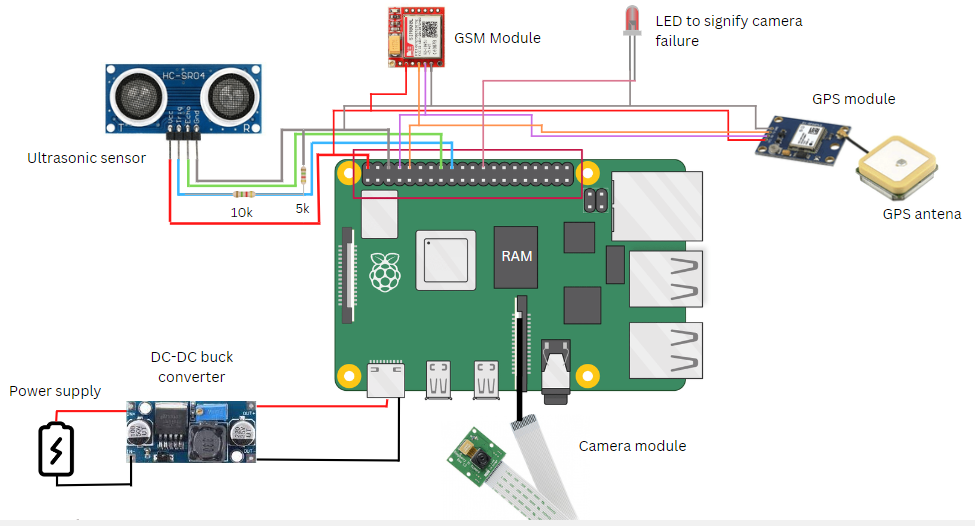
components
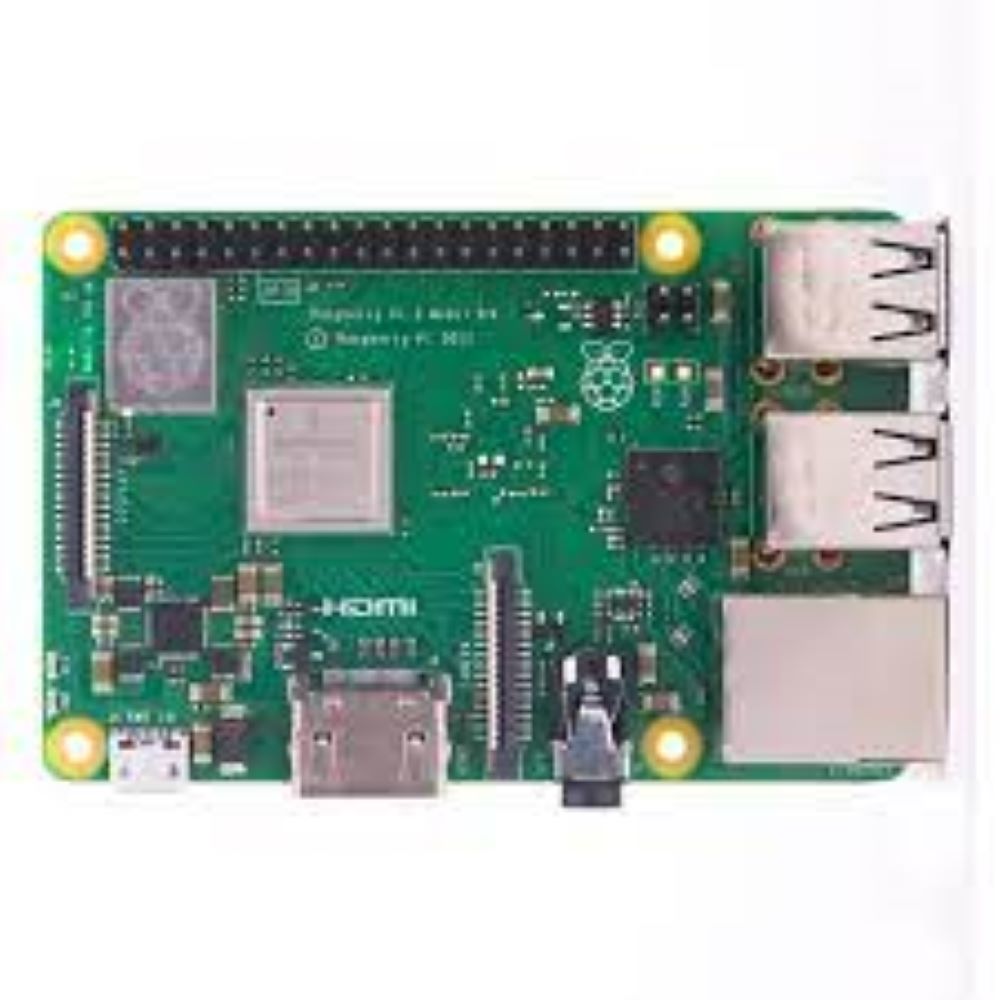
Raspberry Pi 3B+
- 5V/2.5A DC power input
- Built-in wifi module
- Micro SD port
- CSI camera port
- Full-size HDMI
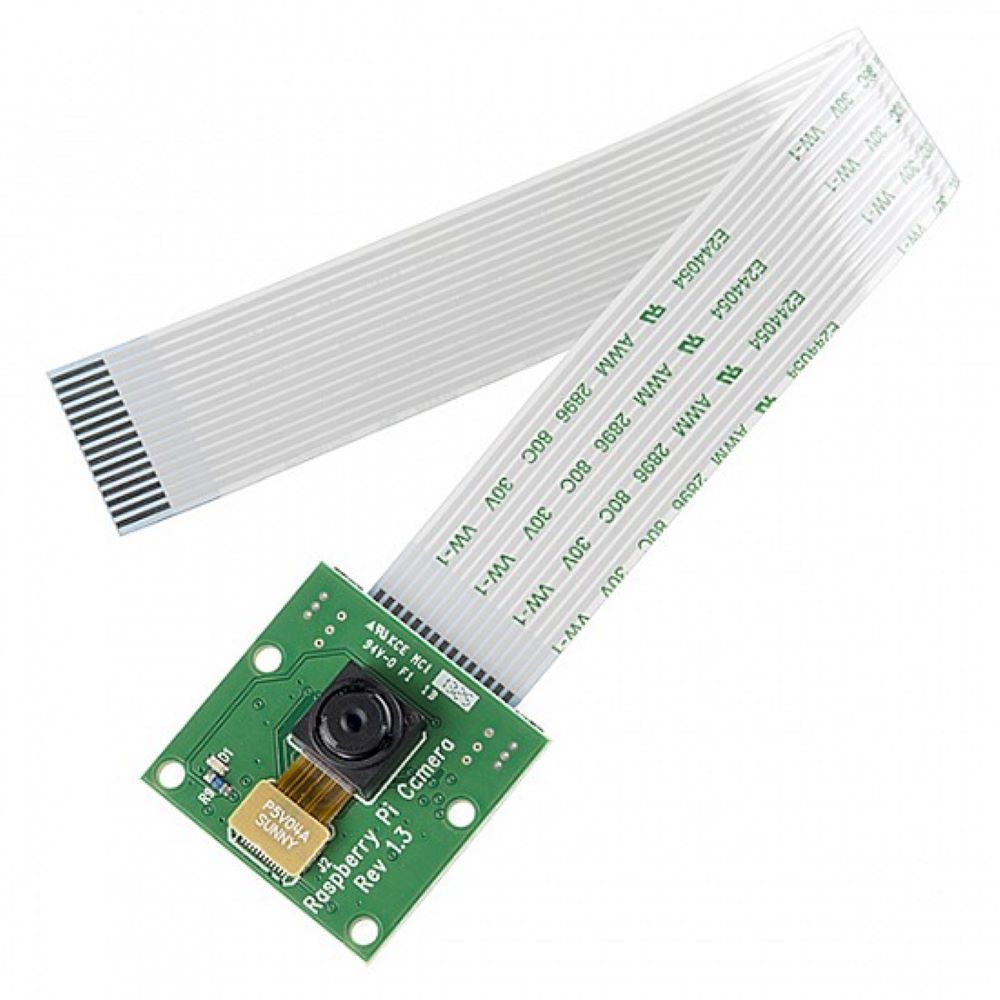
Raspberry Pi Camera
- 5 megapixel camera
- Pixel Count 2592 x 1944
- Capture video at 1080p30 with H.264 encoding
- Angle of View 54 x 41 degrees
- Field of View 2.0 x 1.33 m at 2 m
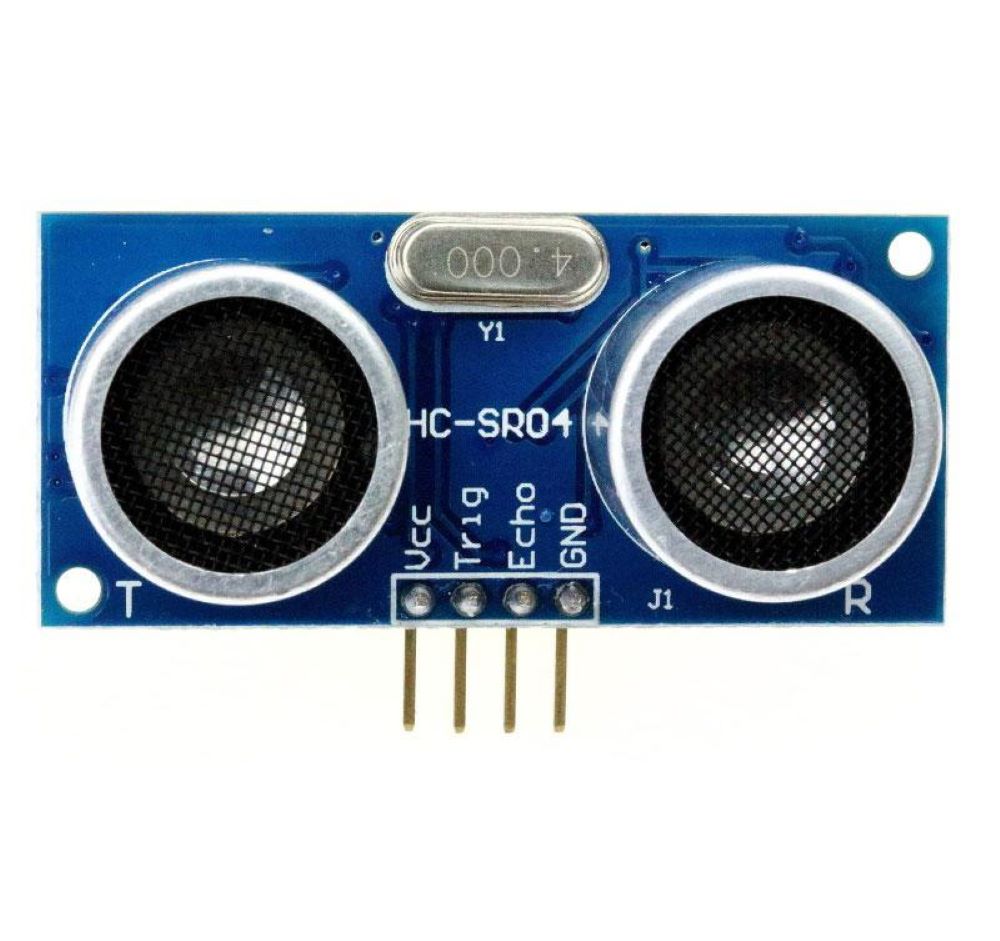
Ultrasonic Sensor (HC-SR04)
- 3V-5V DC power input
- 0.1- 1% accuracy for 10m
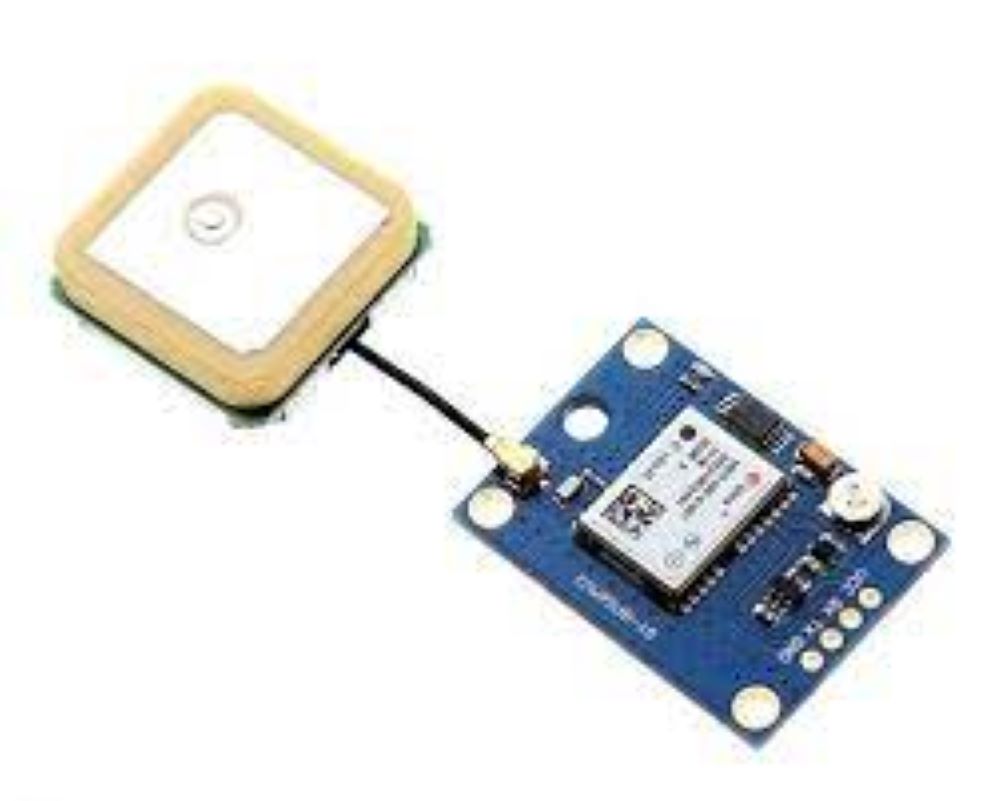
GPS Module (Neo-6M)
- 3V-5V DC power input
- 2.5m GPS Horizontal Position
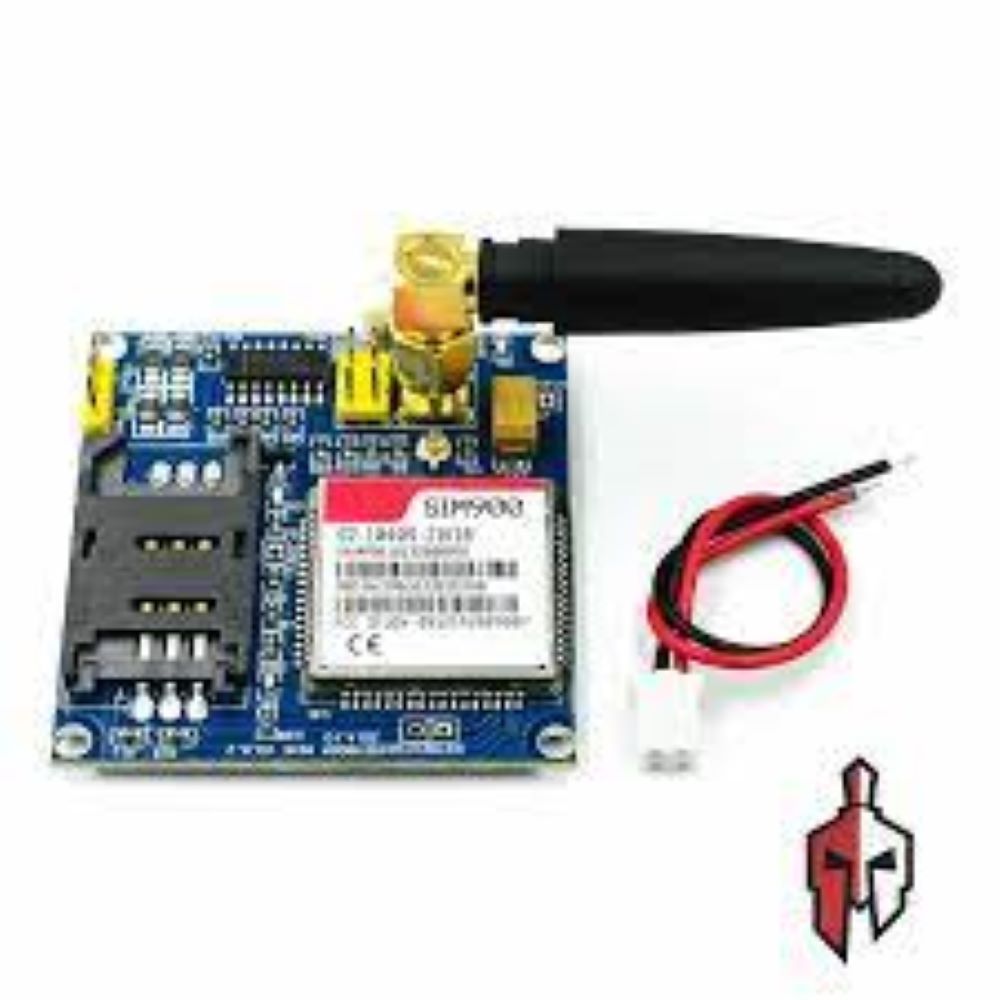
GSM Module SIM900A Mini V3.8.2
- 5V/1A DC power input
- GPRS multi-slot class 10/8GPRS mobile station class B
- Control via AT commands
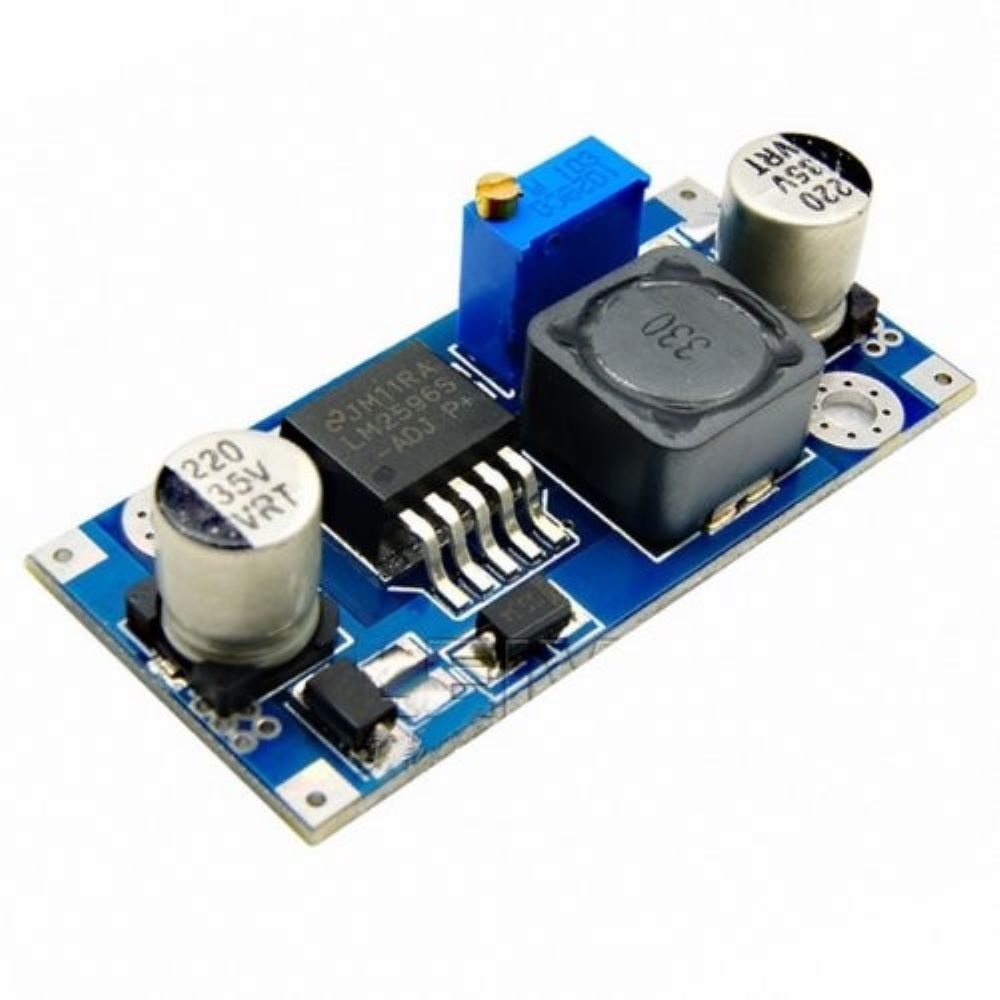
DC-DC Buck Converter (LM2596)
- Input voltage: 3-40V
- Output voltage: 1.5-35V(Adjustable)
- Output current: Rated current is 2A, maximum 3A
- Switching Frequency: 150KHz
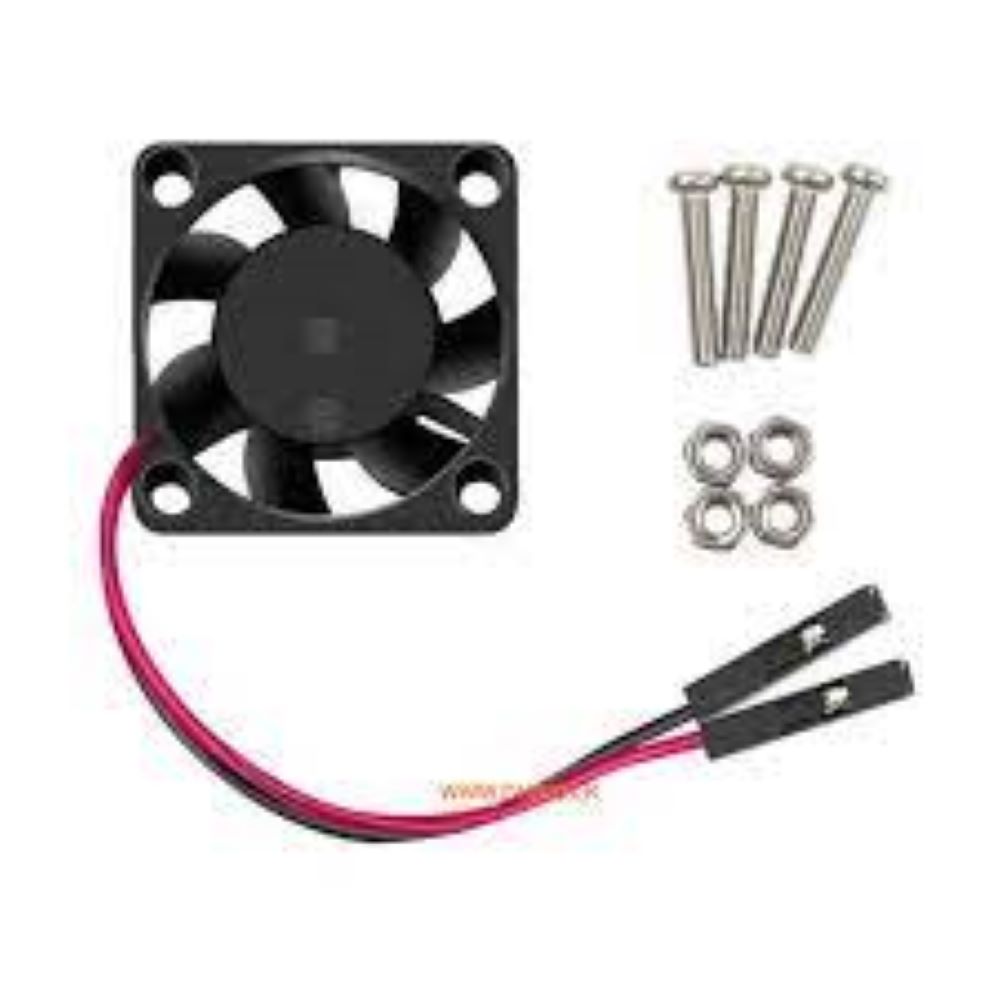
Cooling fan
3D Model
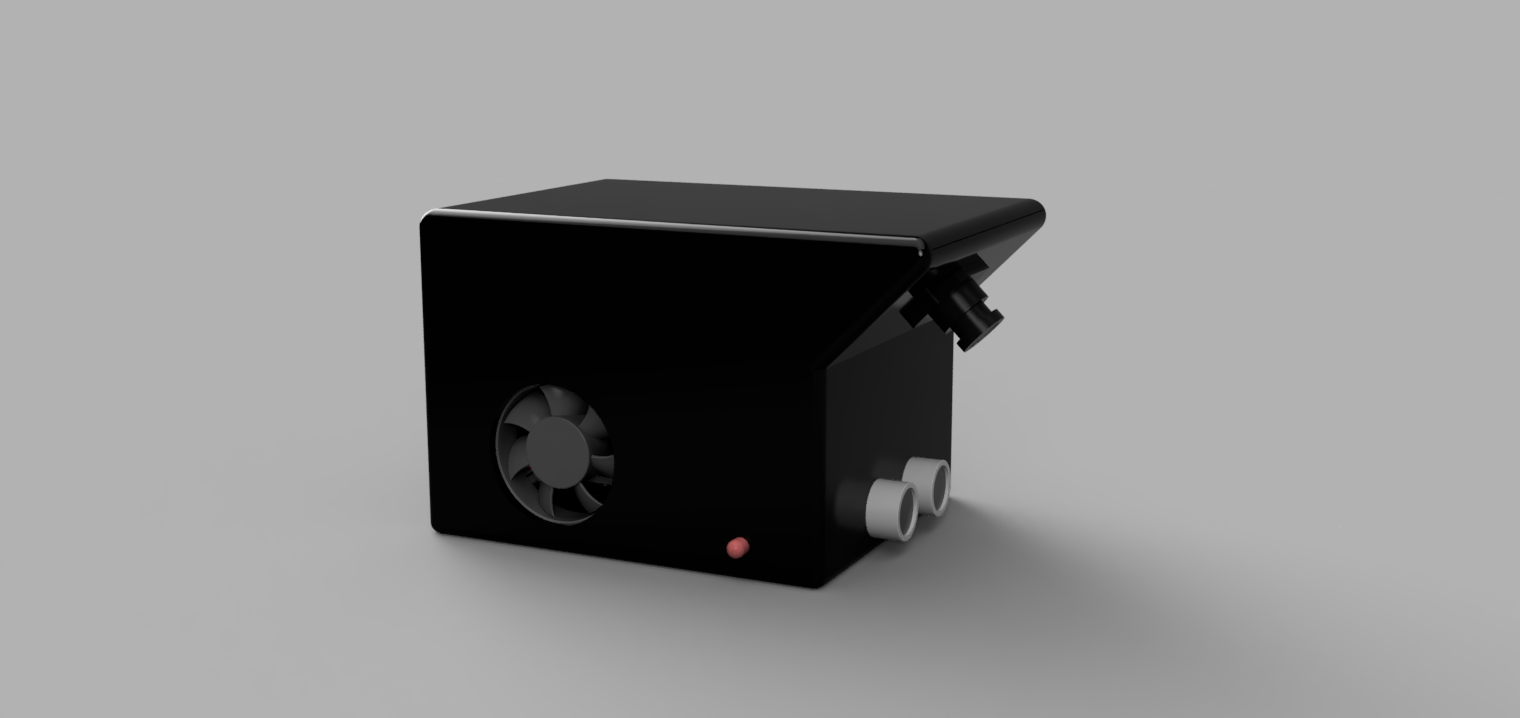
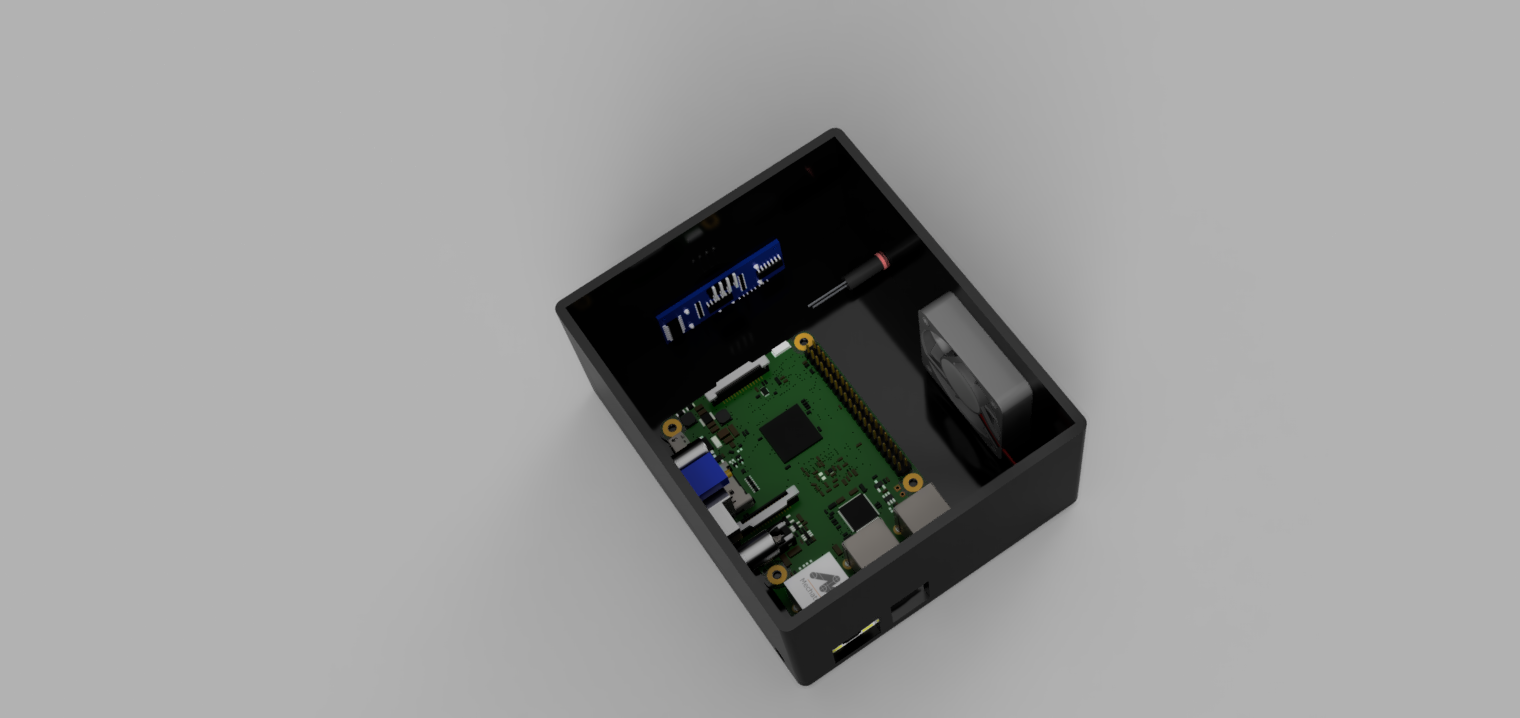
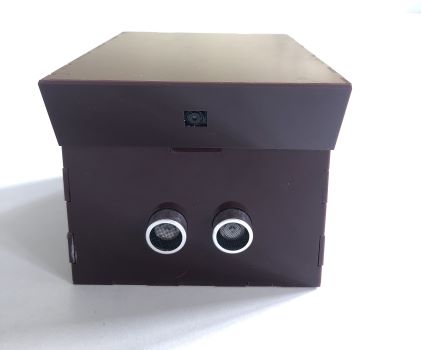
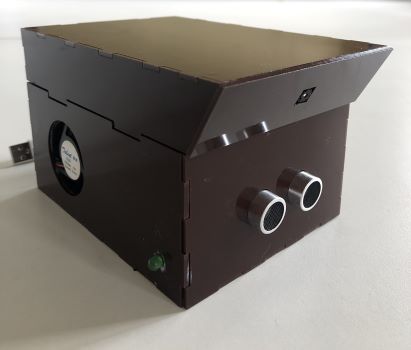
Final product
UI designs
Main users of this application are police officers.They can login to the system using their credentials. After login to the system they can view the analysis of vehicles as necessary.
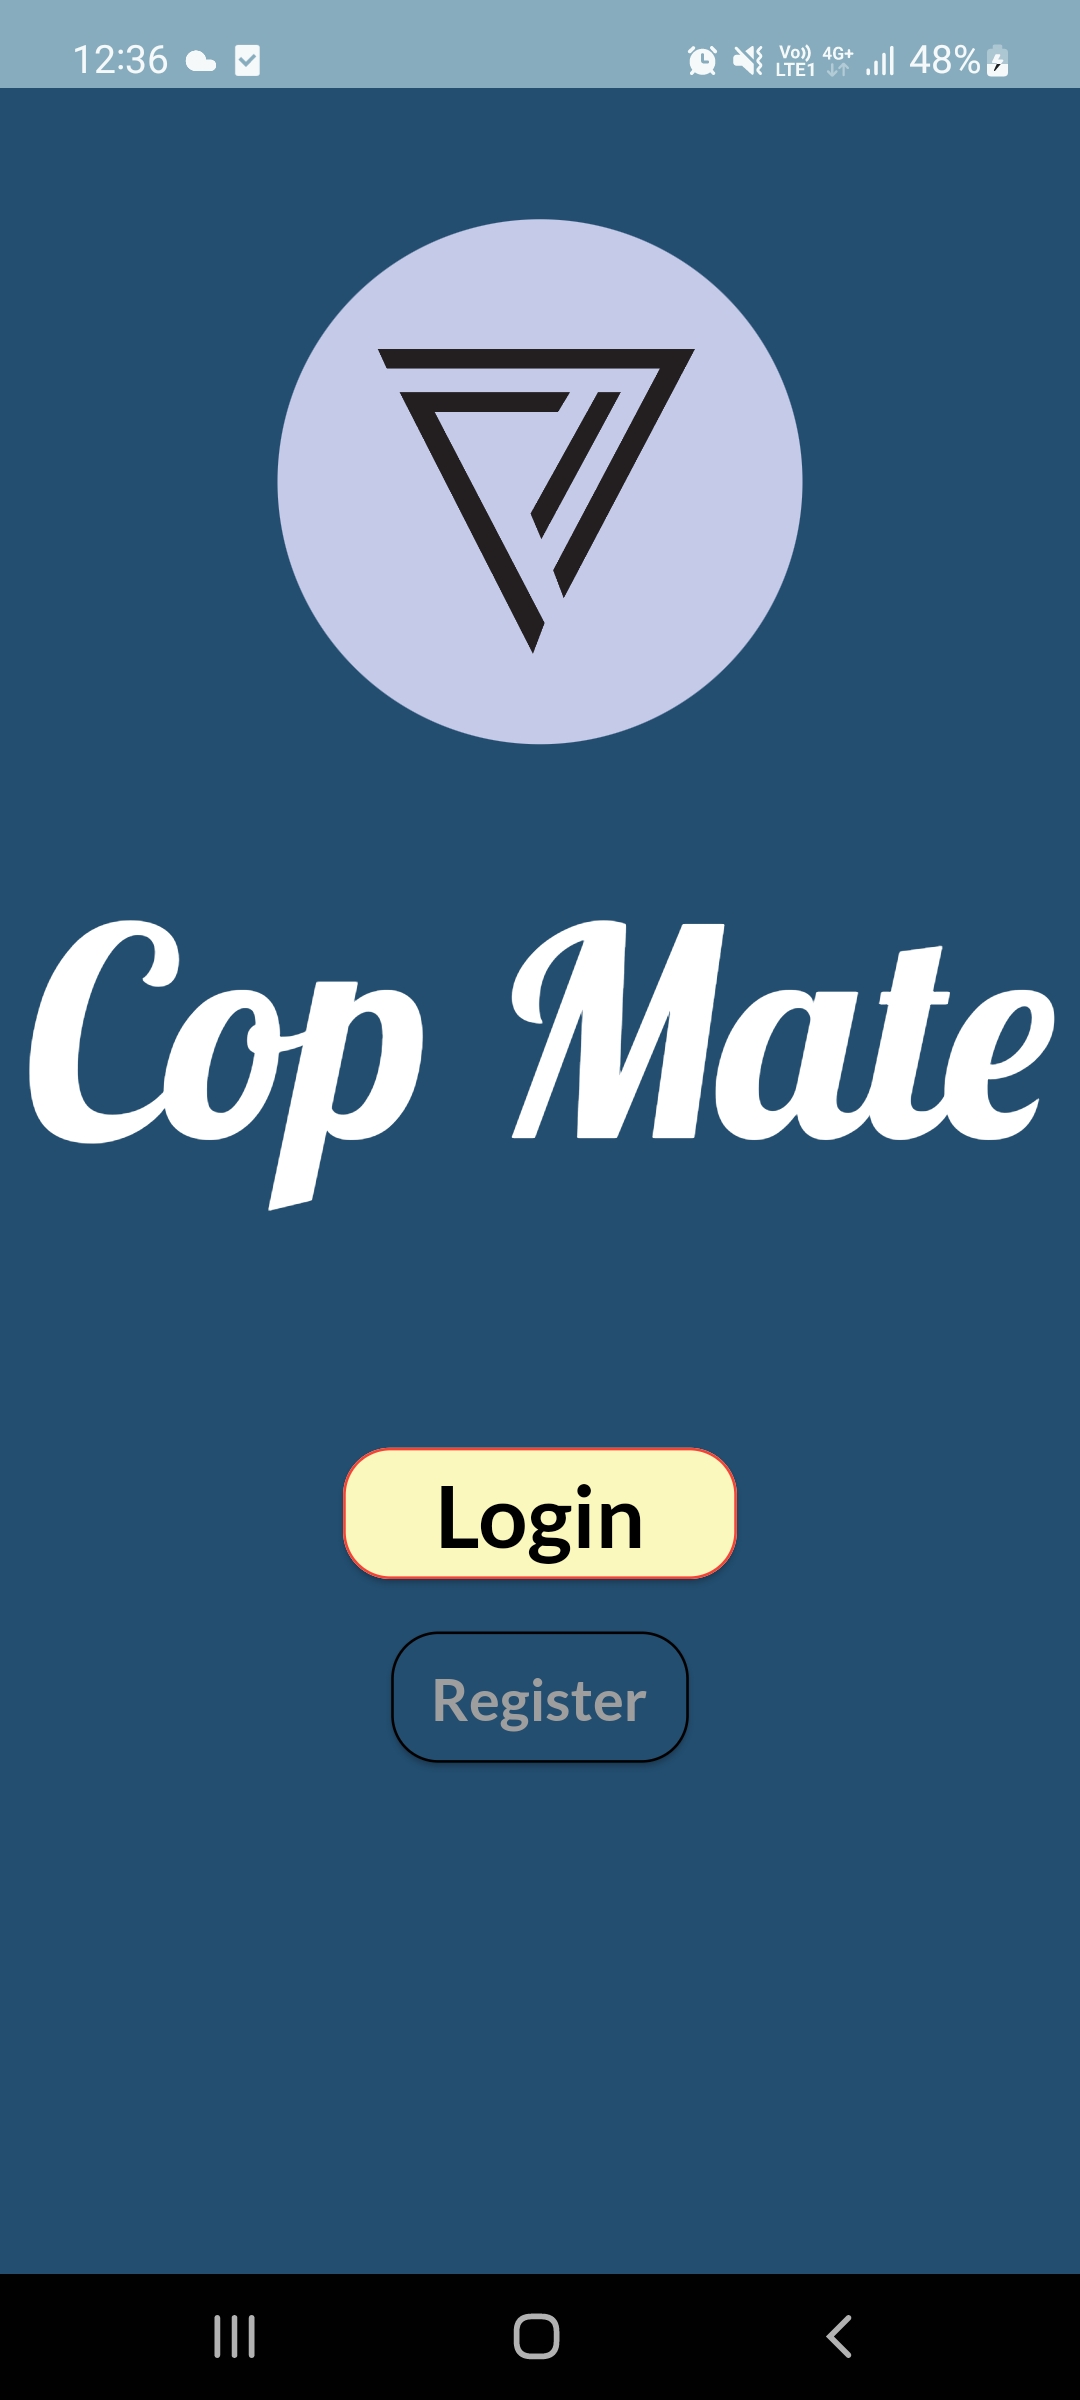
Welcome
Get started
Sign up
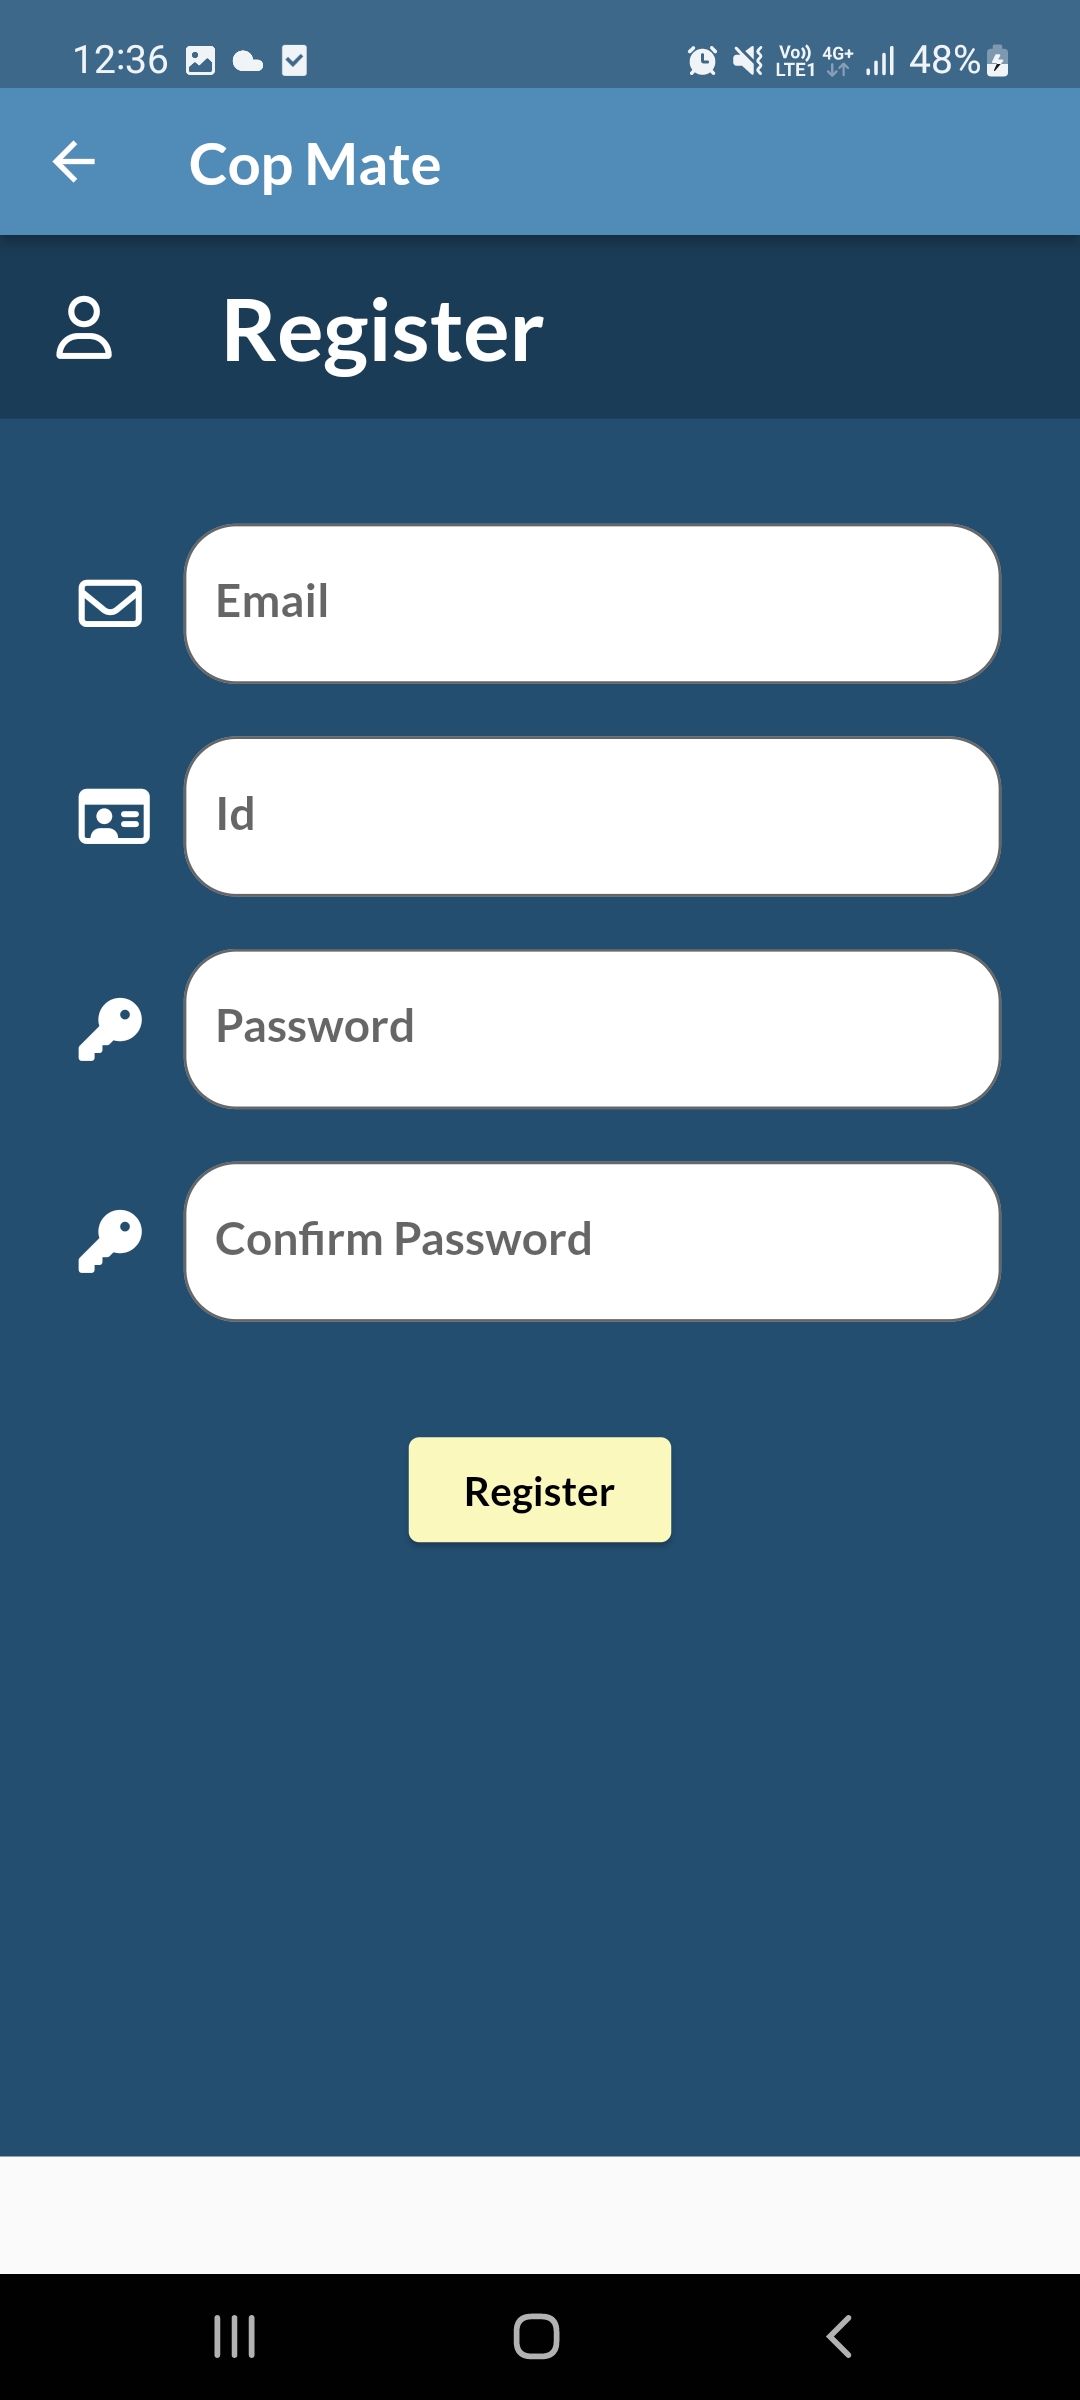
Register user
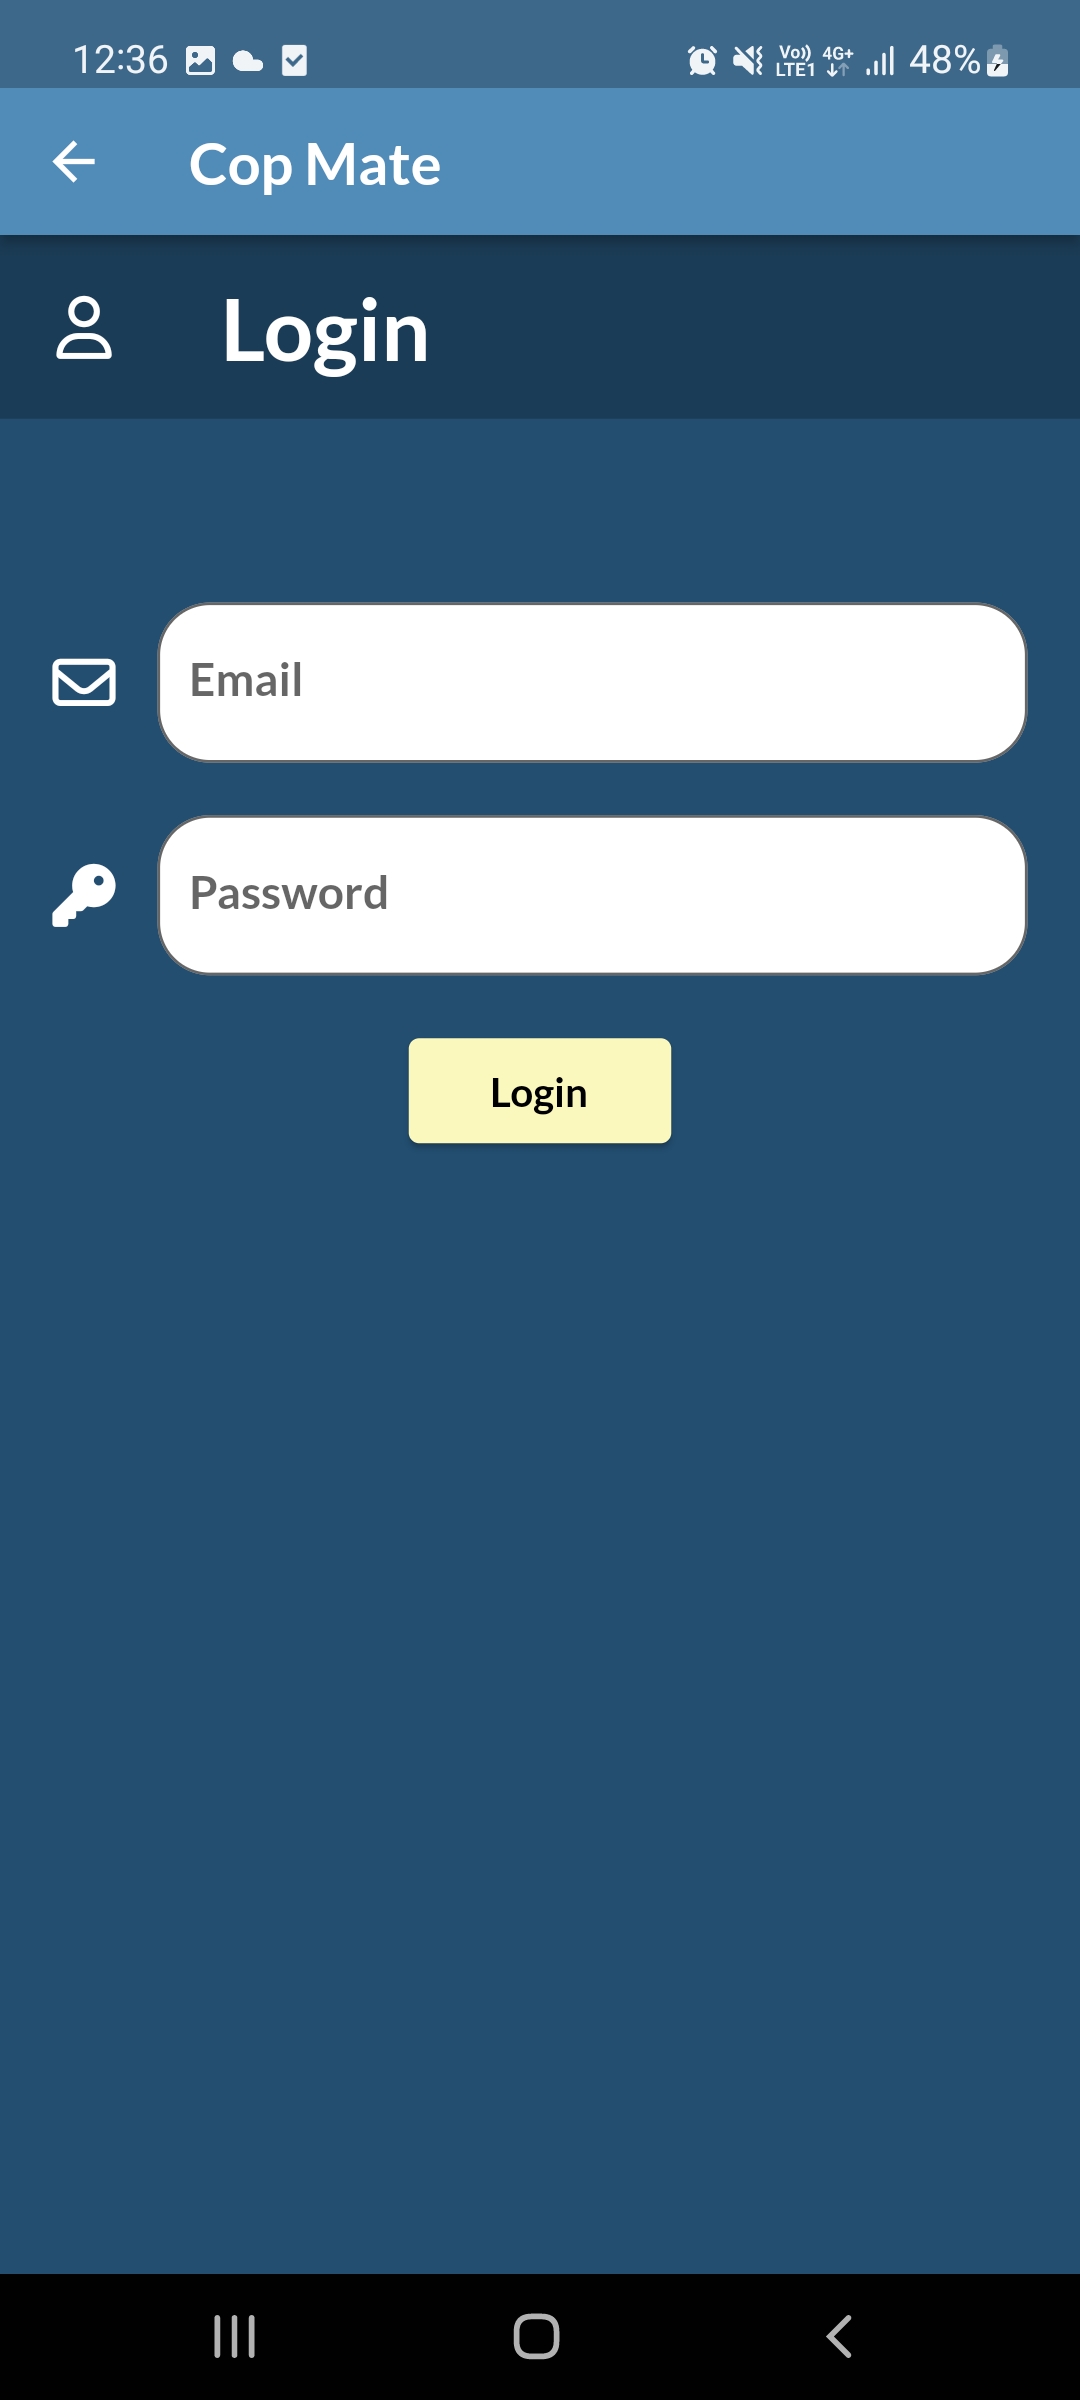
Sign in
Login user
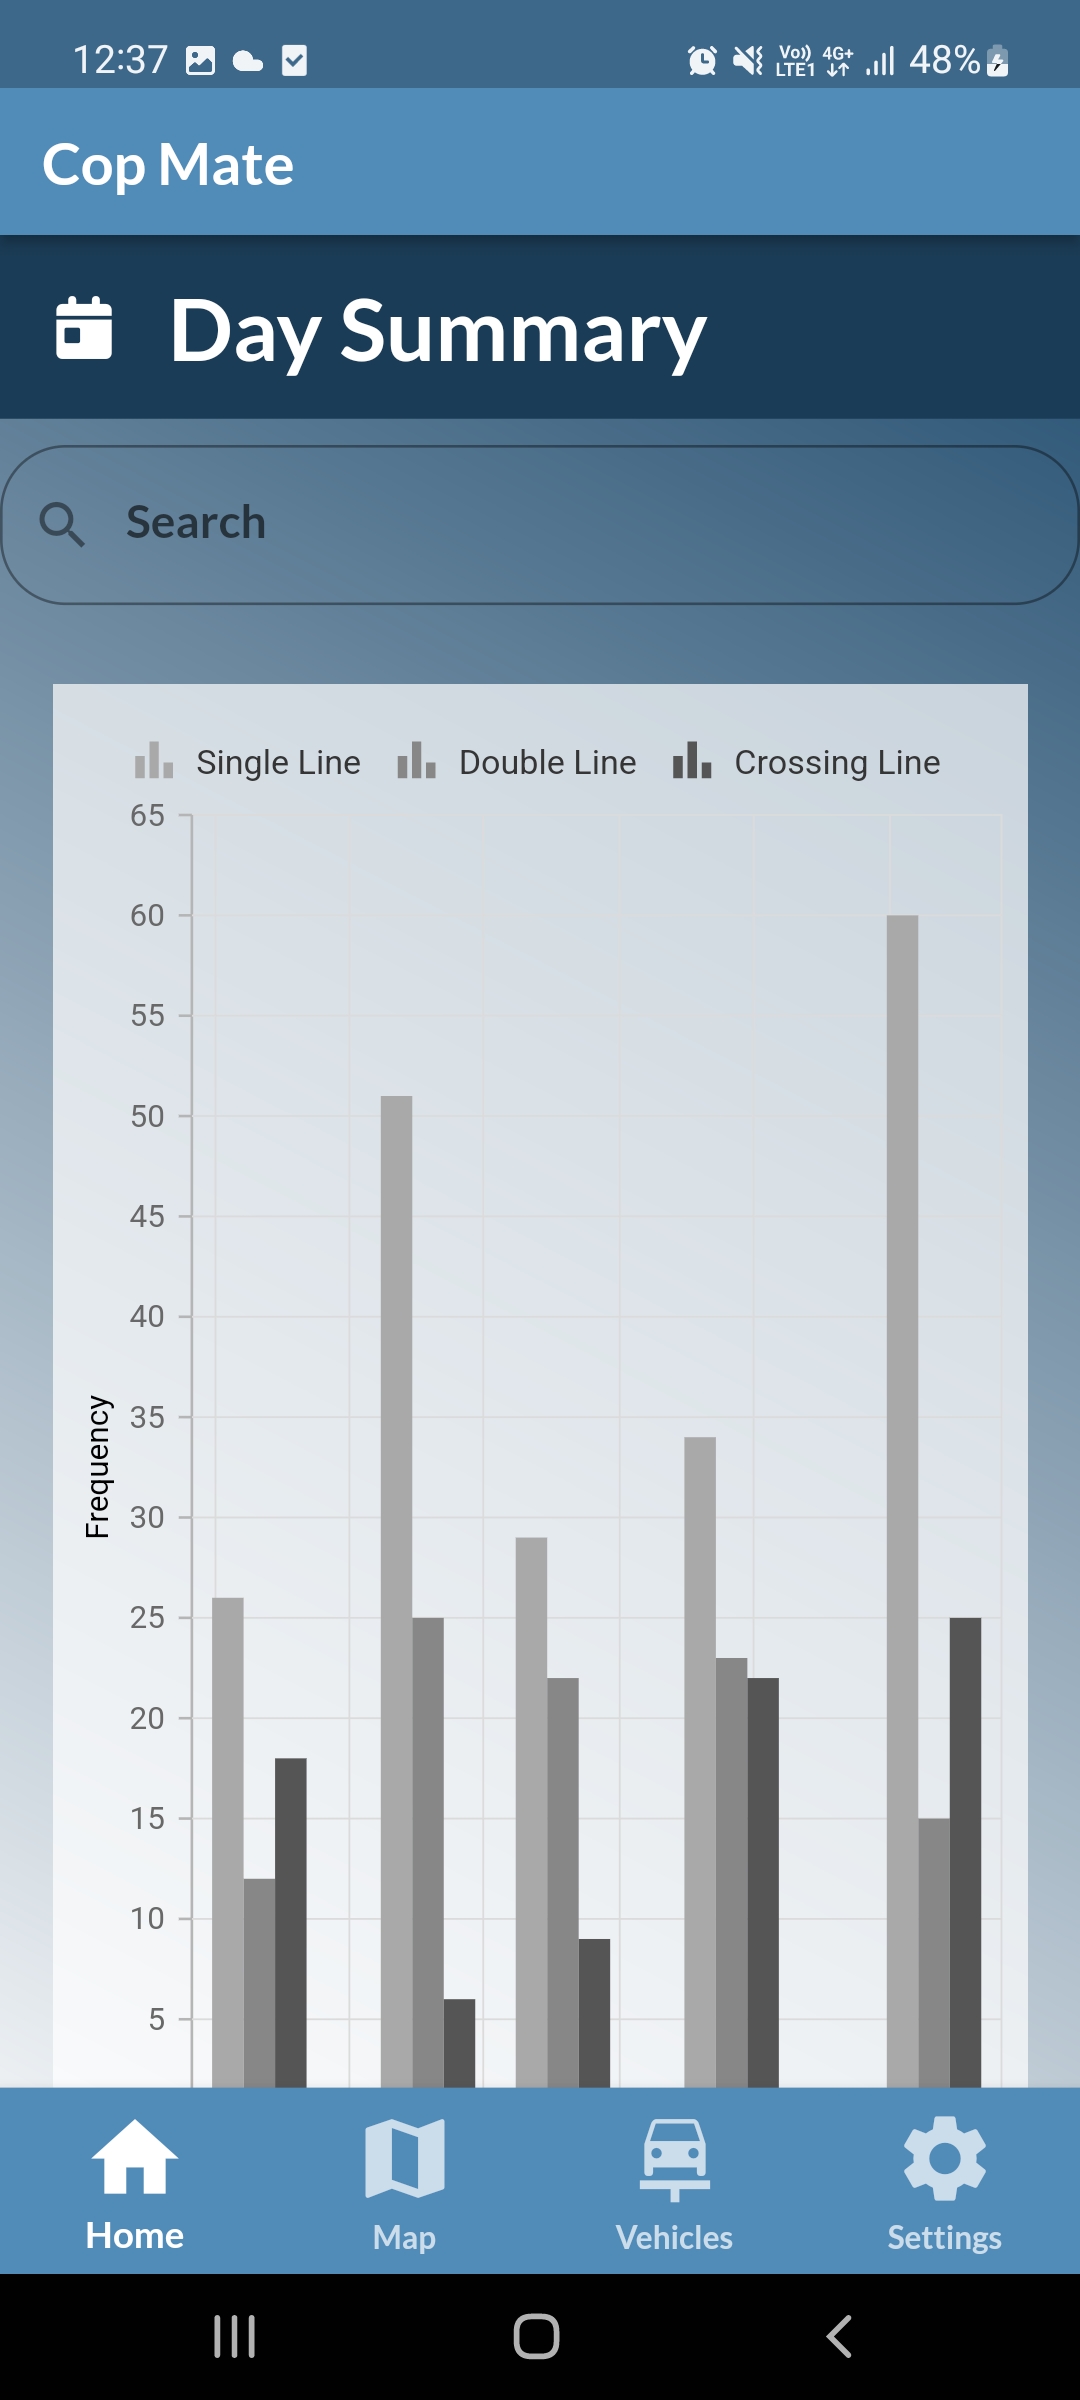
Day Summary Graph
Today's breakages according to the type of lines
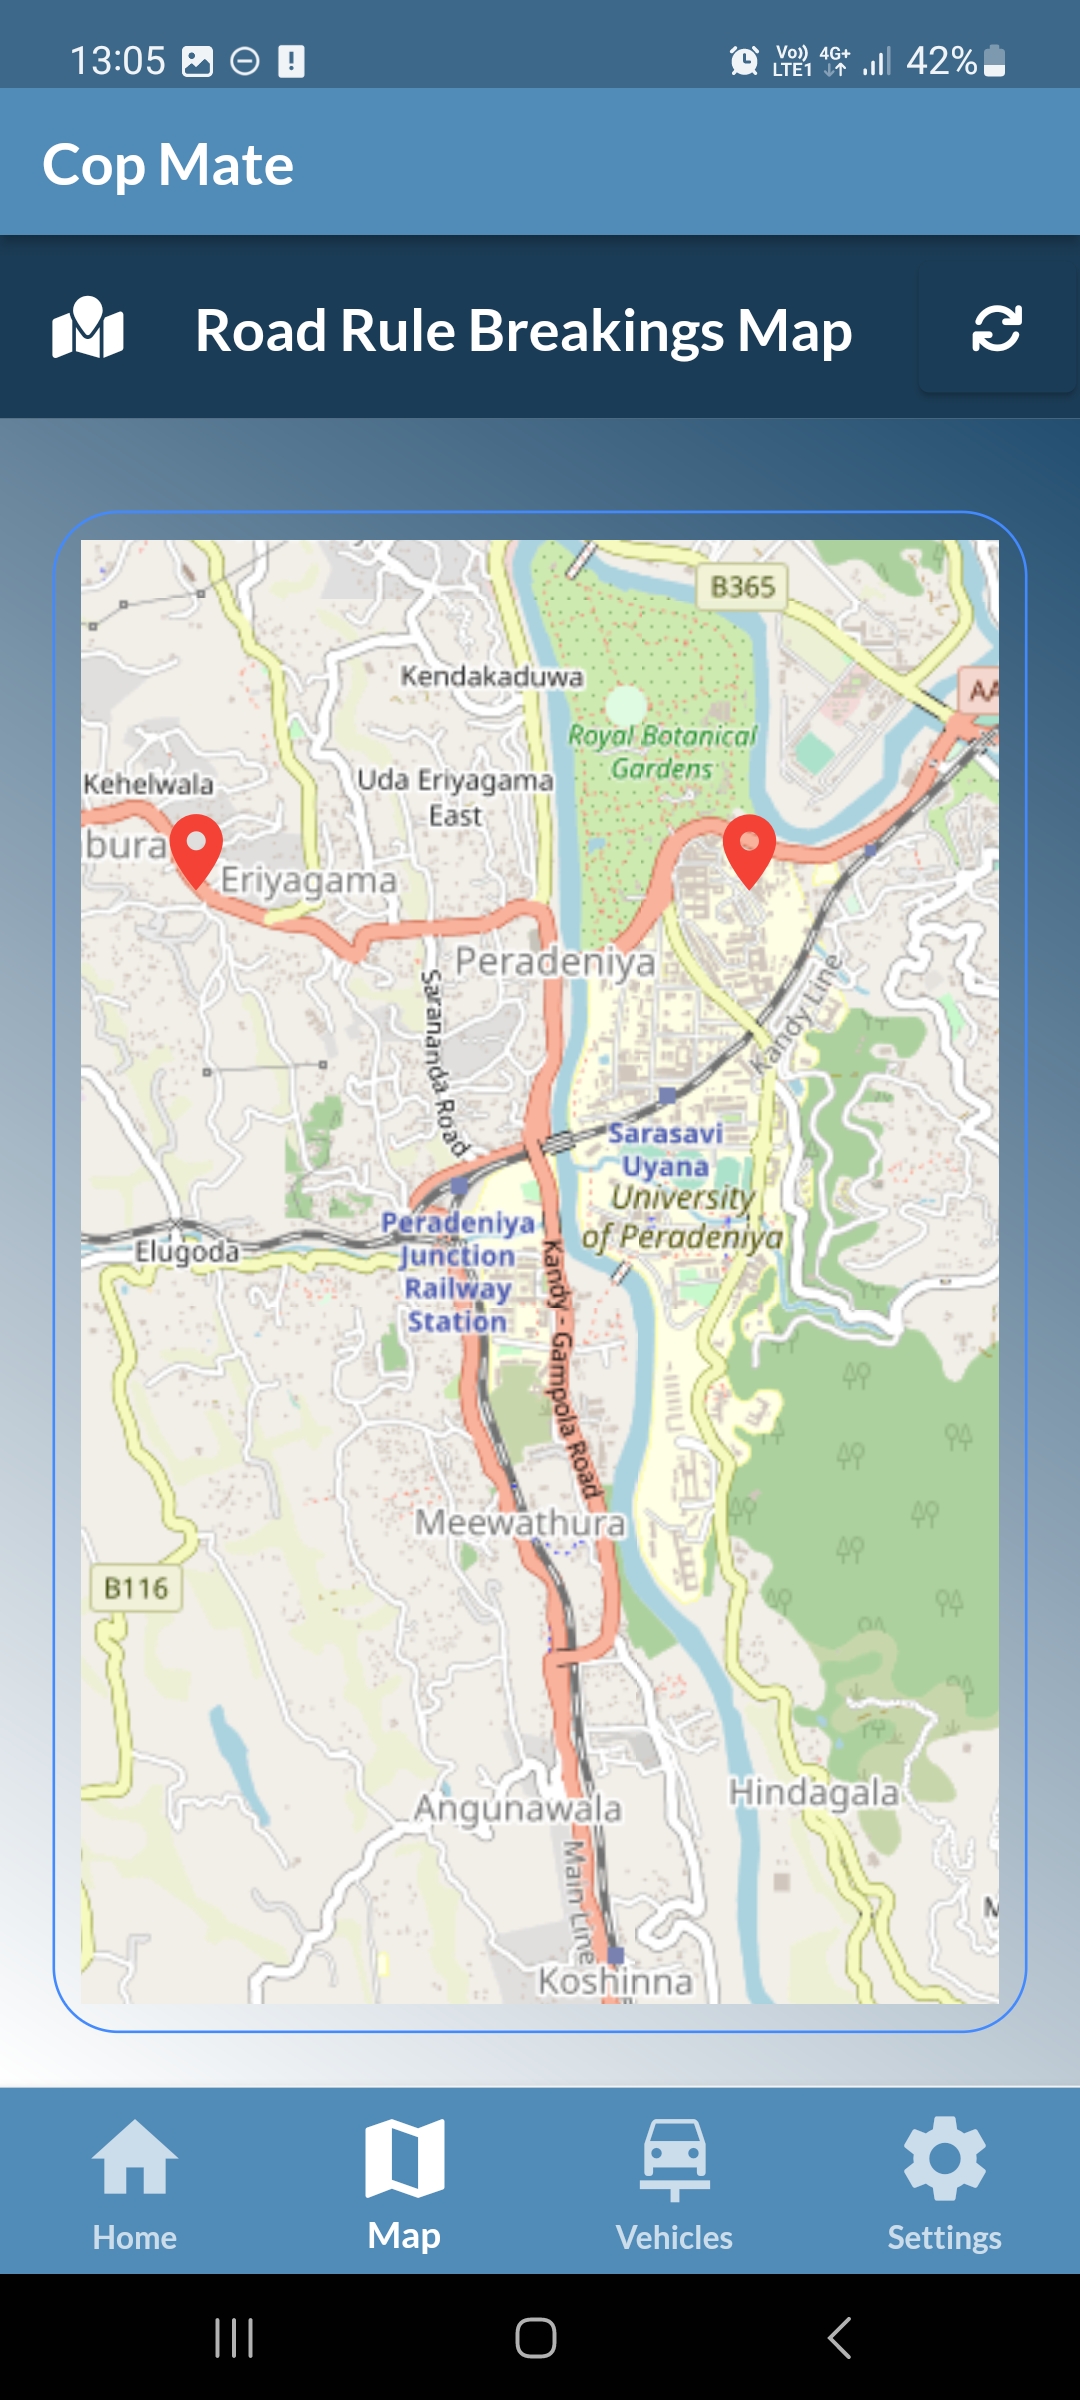
Day Summary Map
Today's breakages according to the location
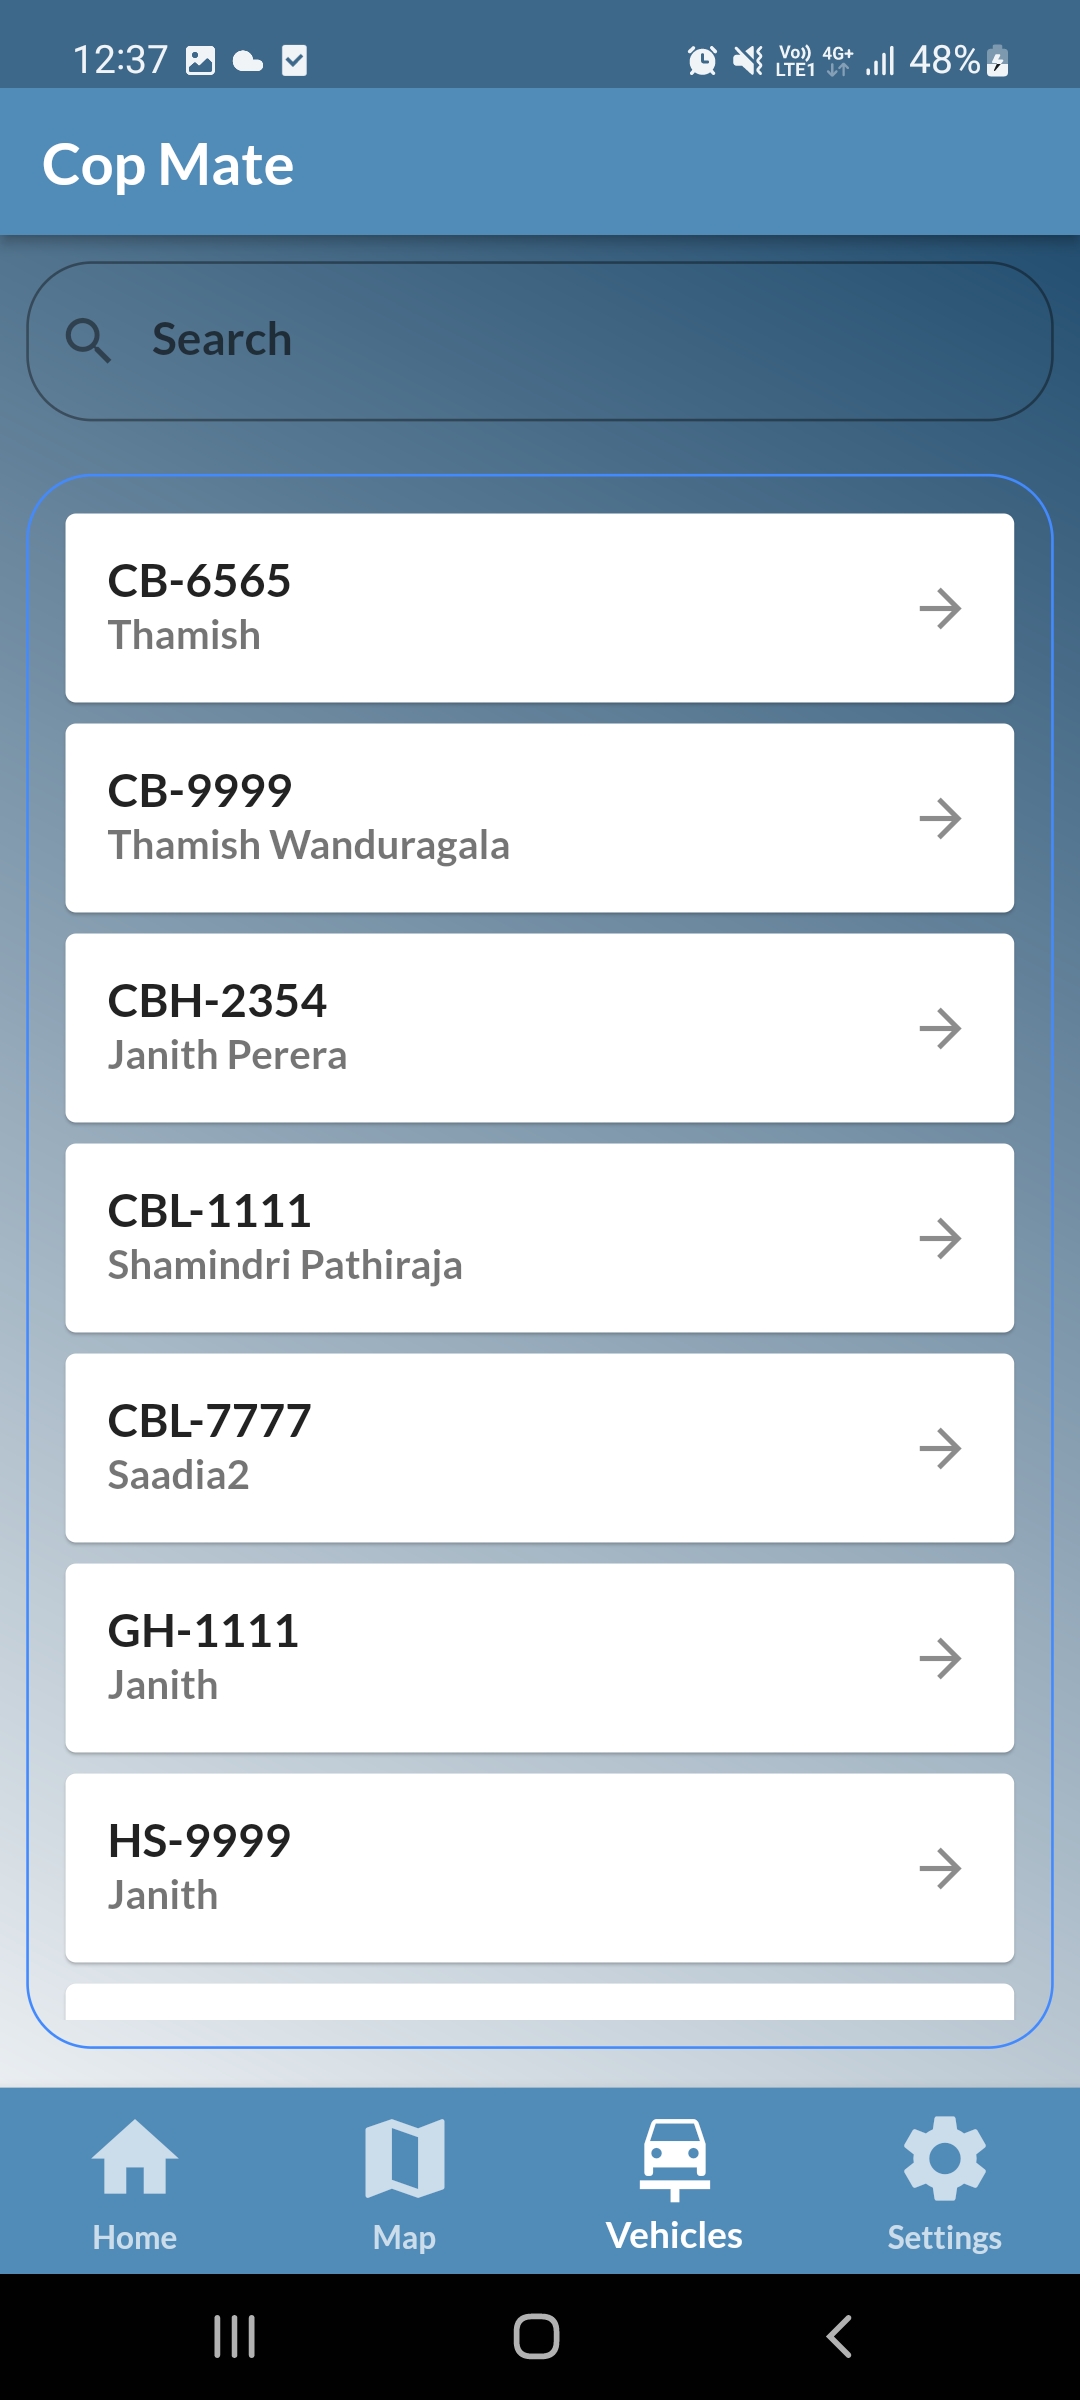
Search a vehicle
Search a particular lisence plate number
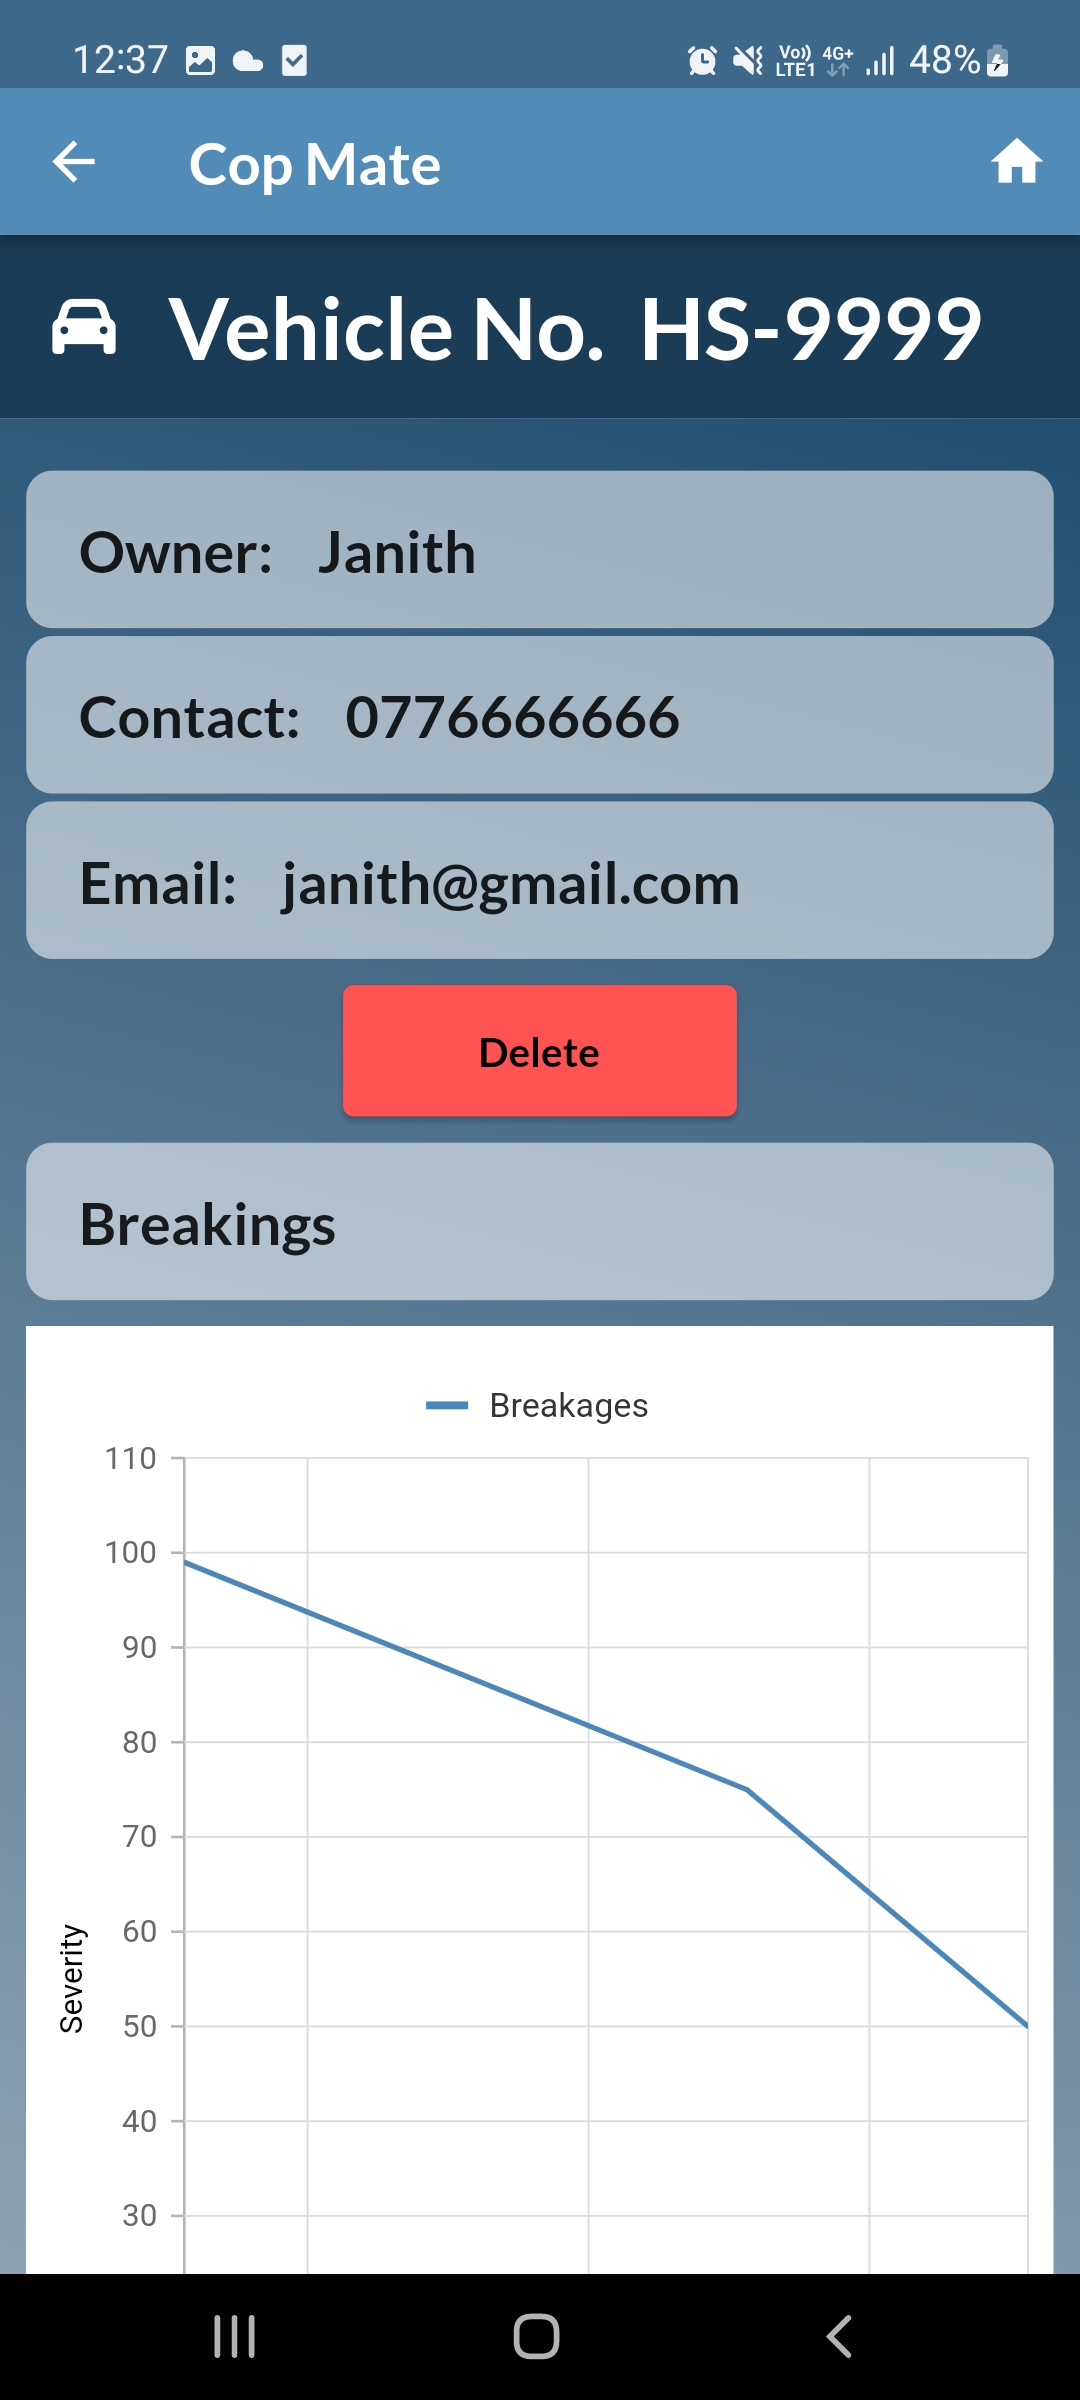
Analyse a vehicle
severity graph of a particular vehicle
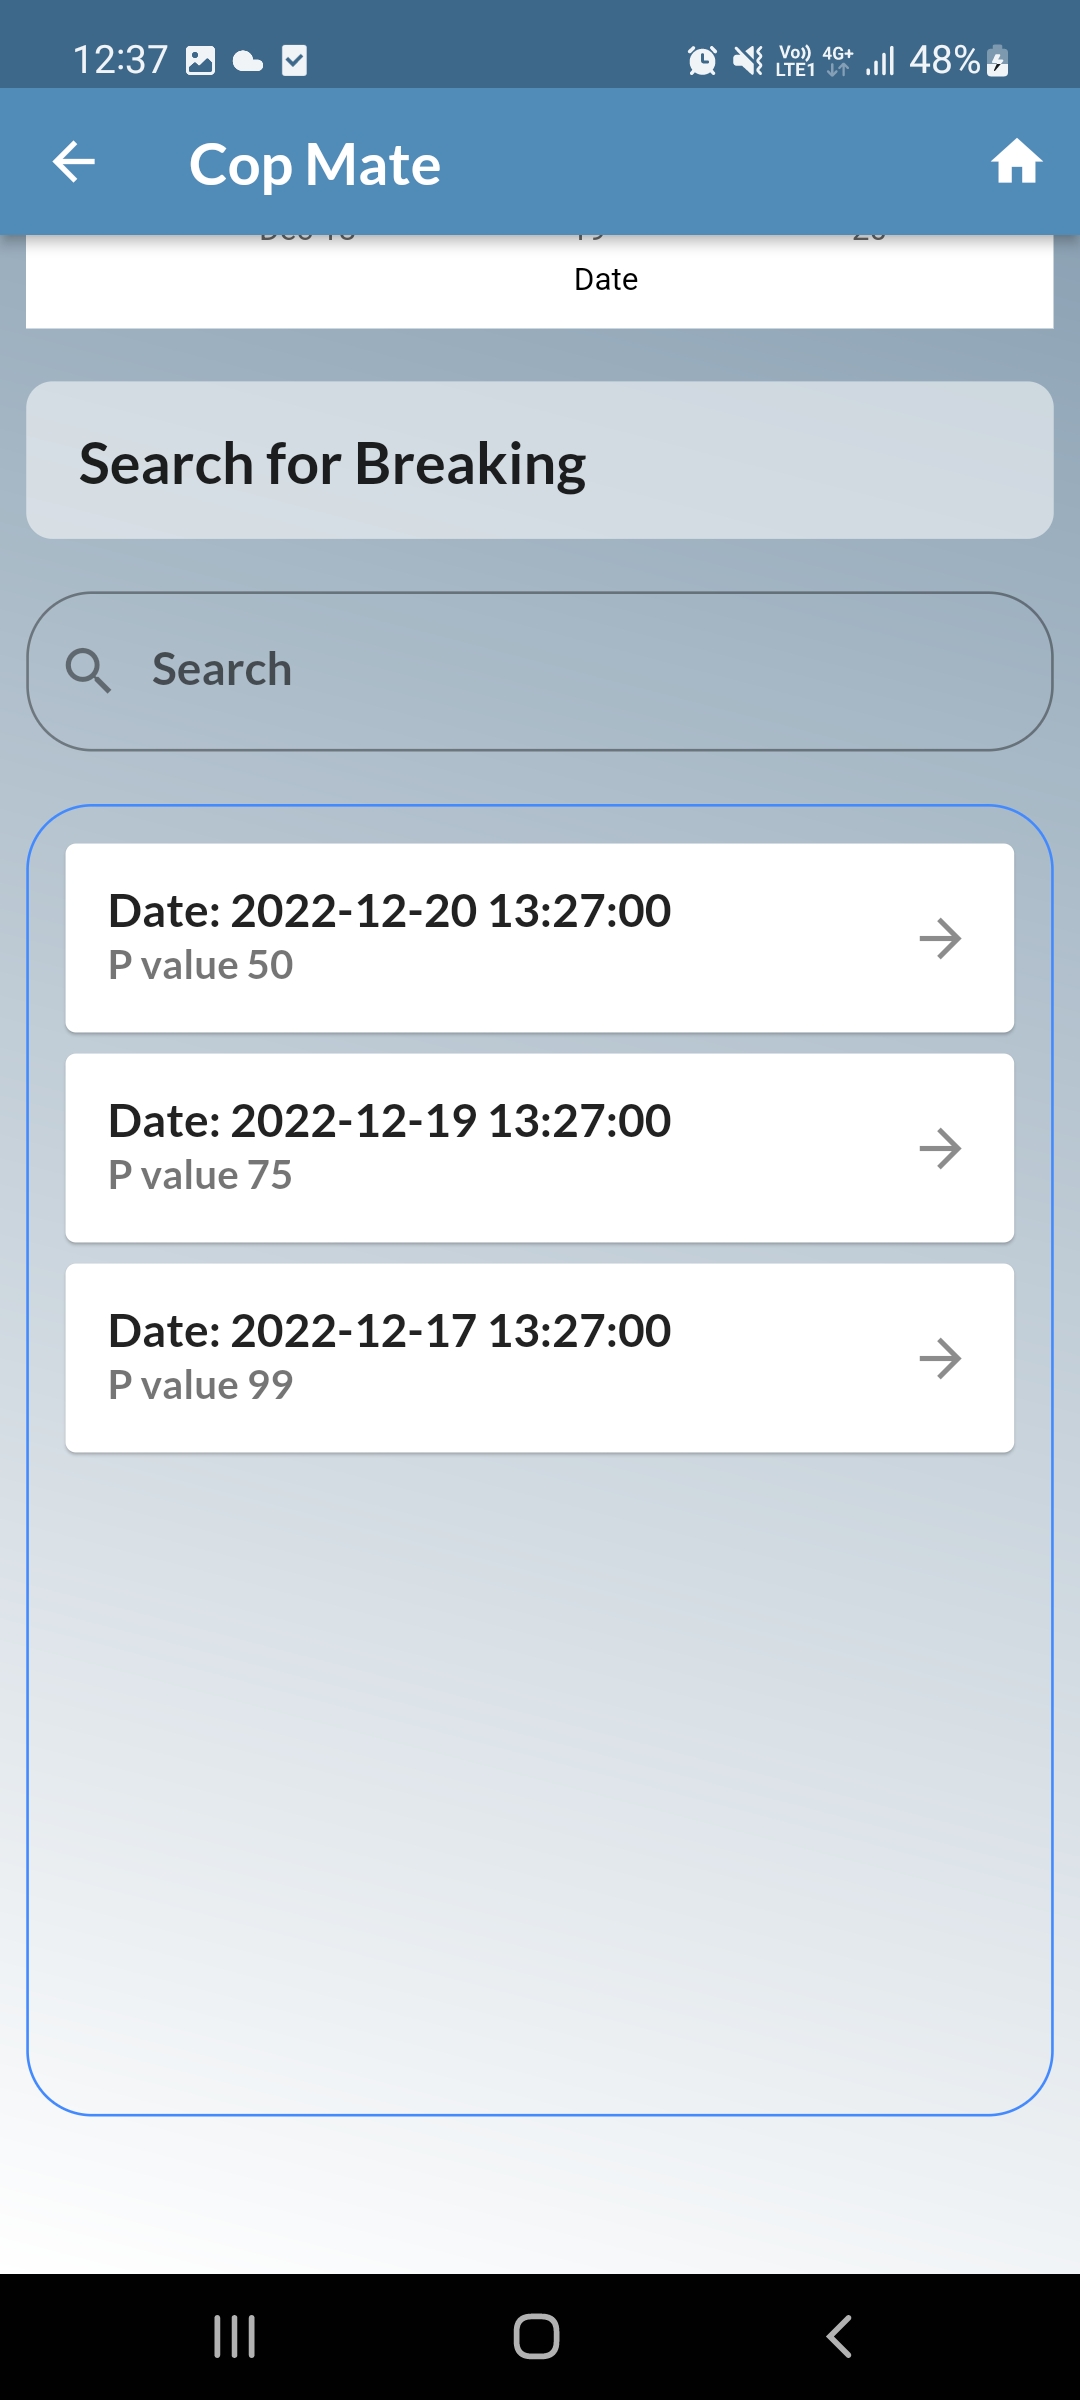
Search a breakage
Search a particular breakage of that vehicle
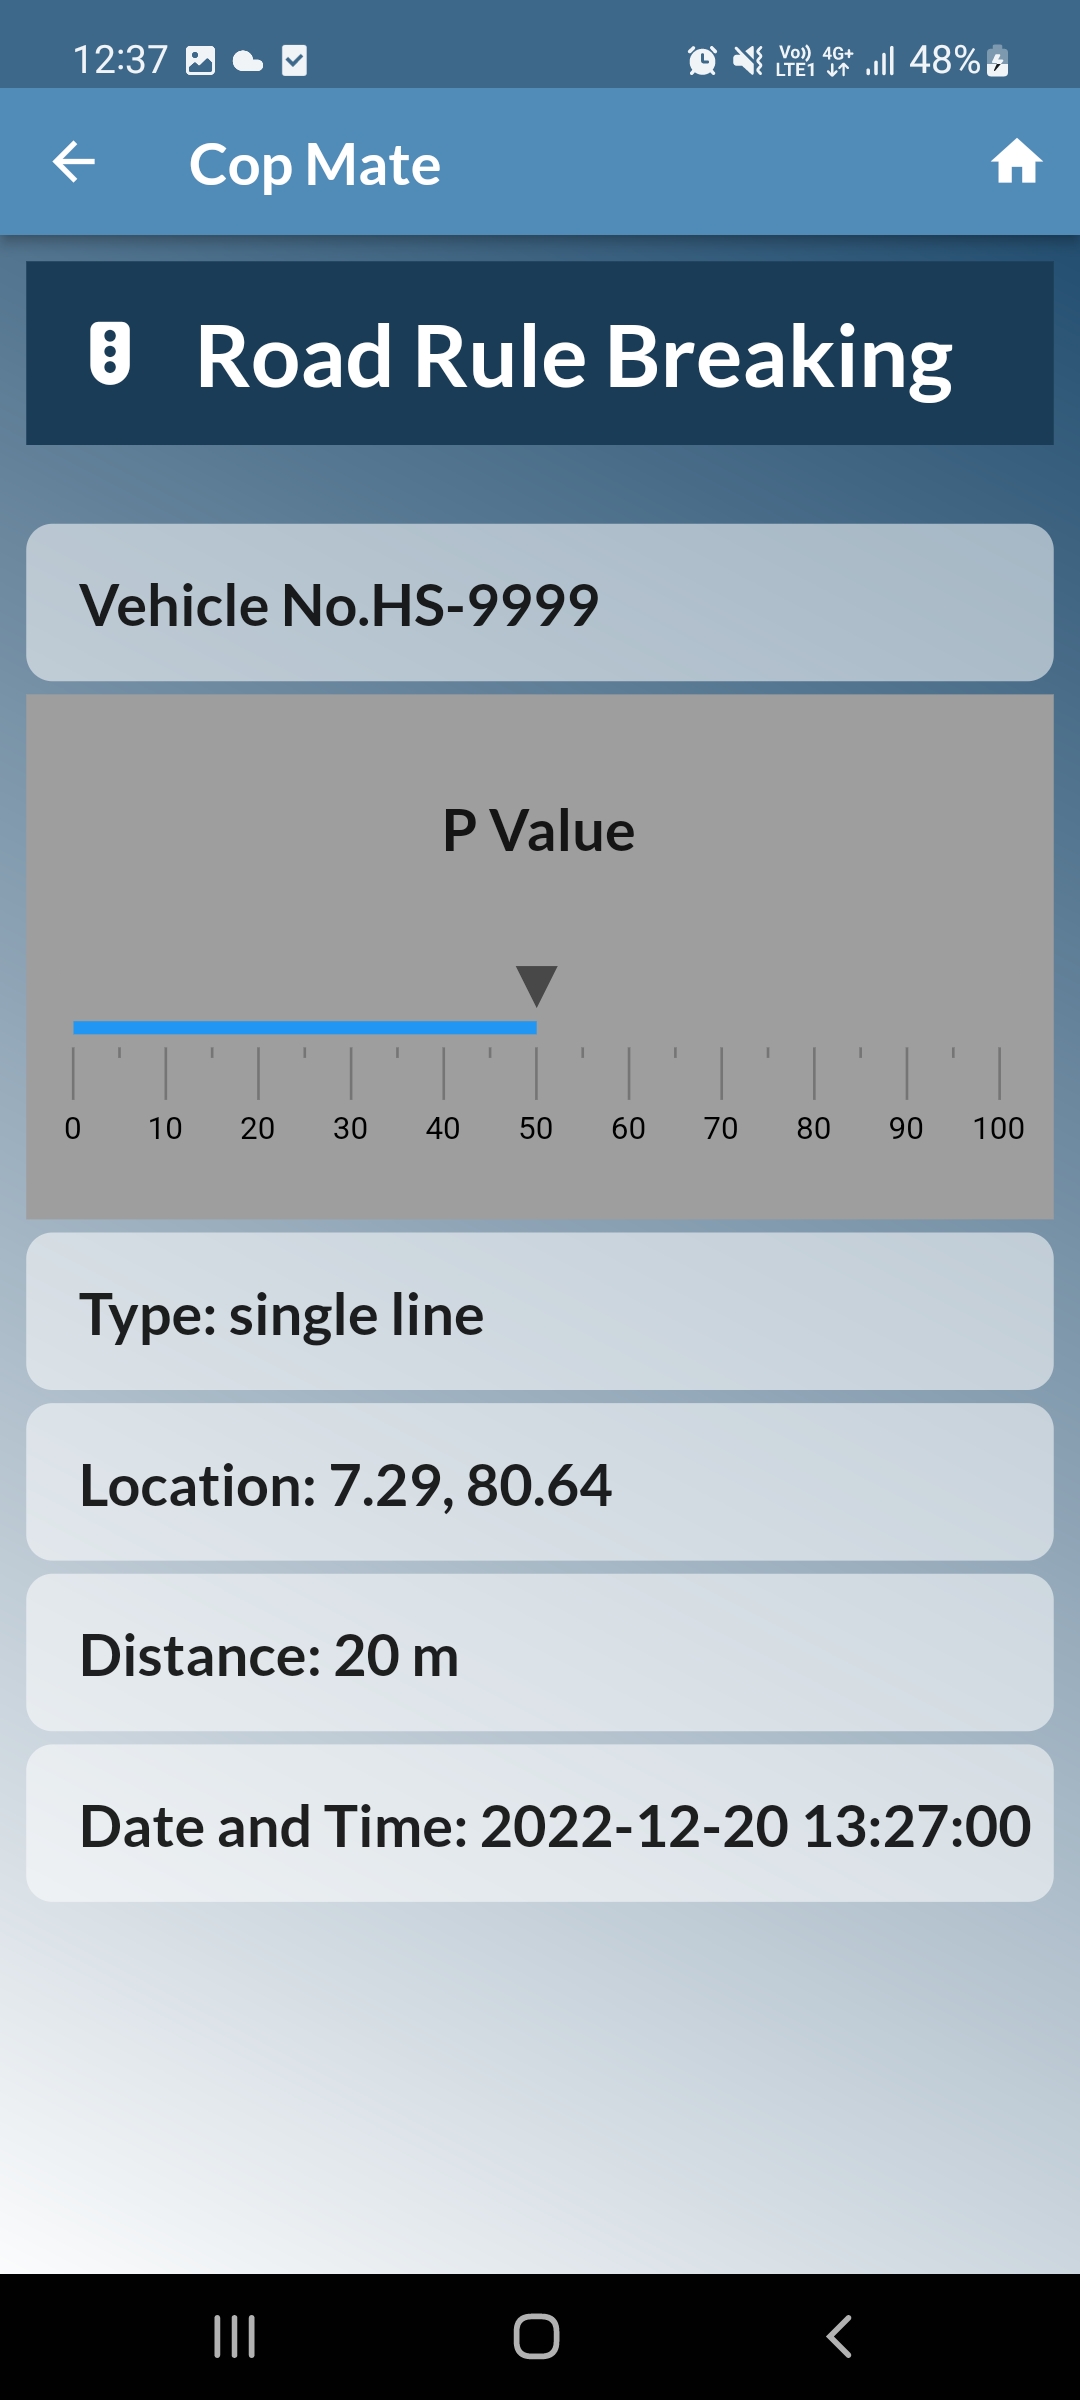
View a breakage
View a particular breakage of that vehicle
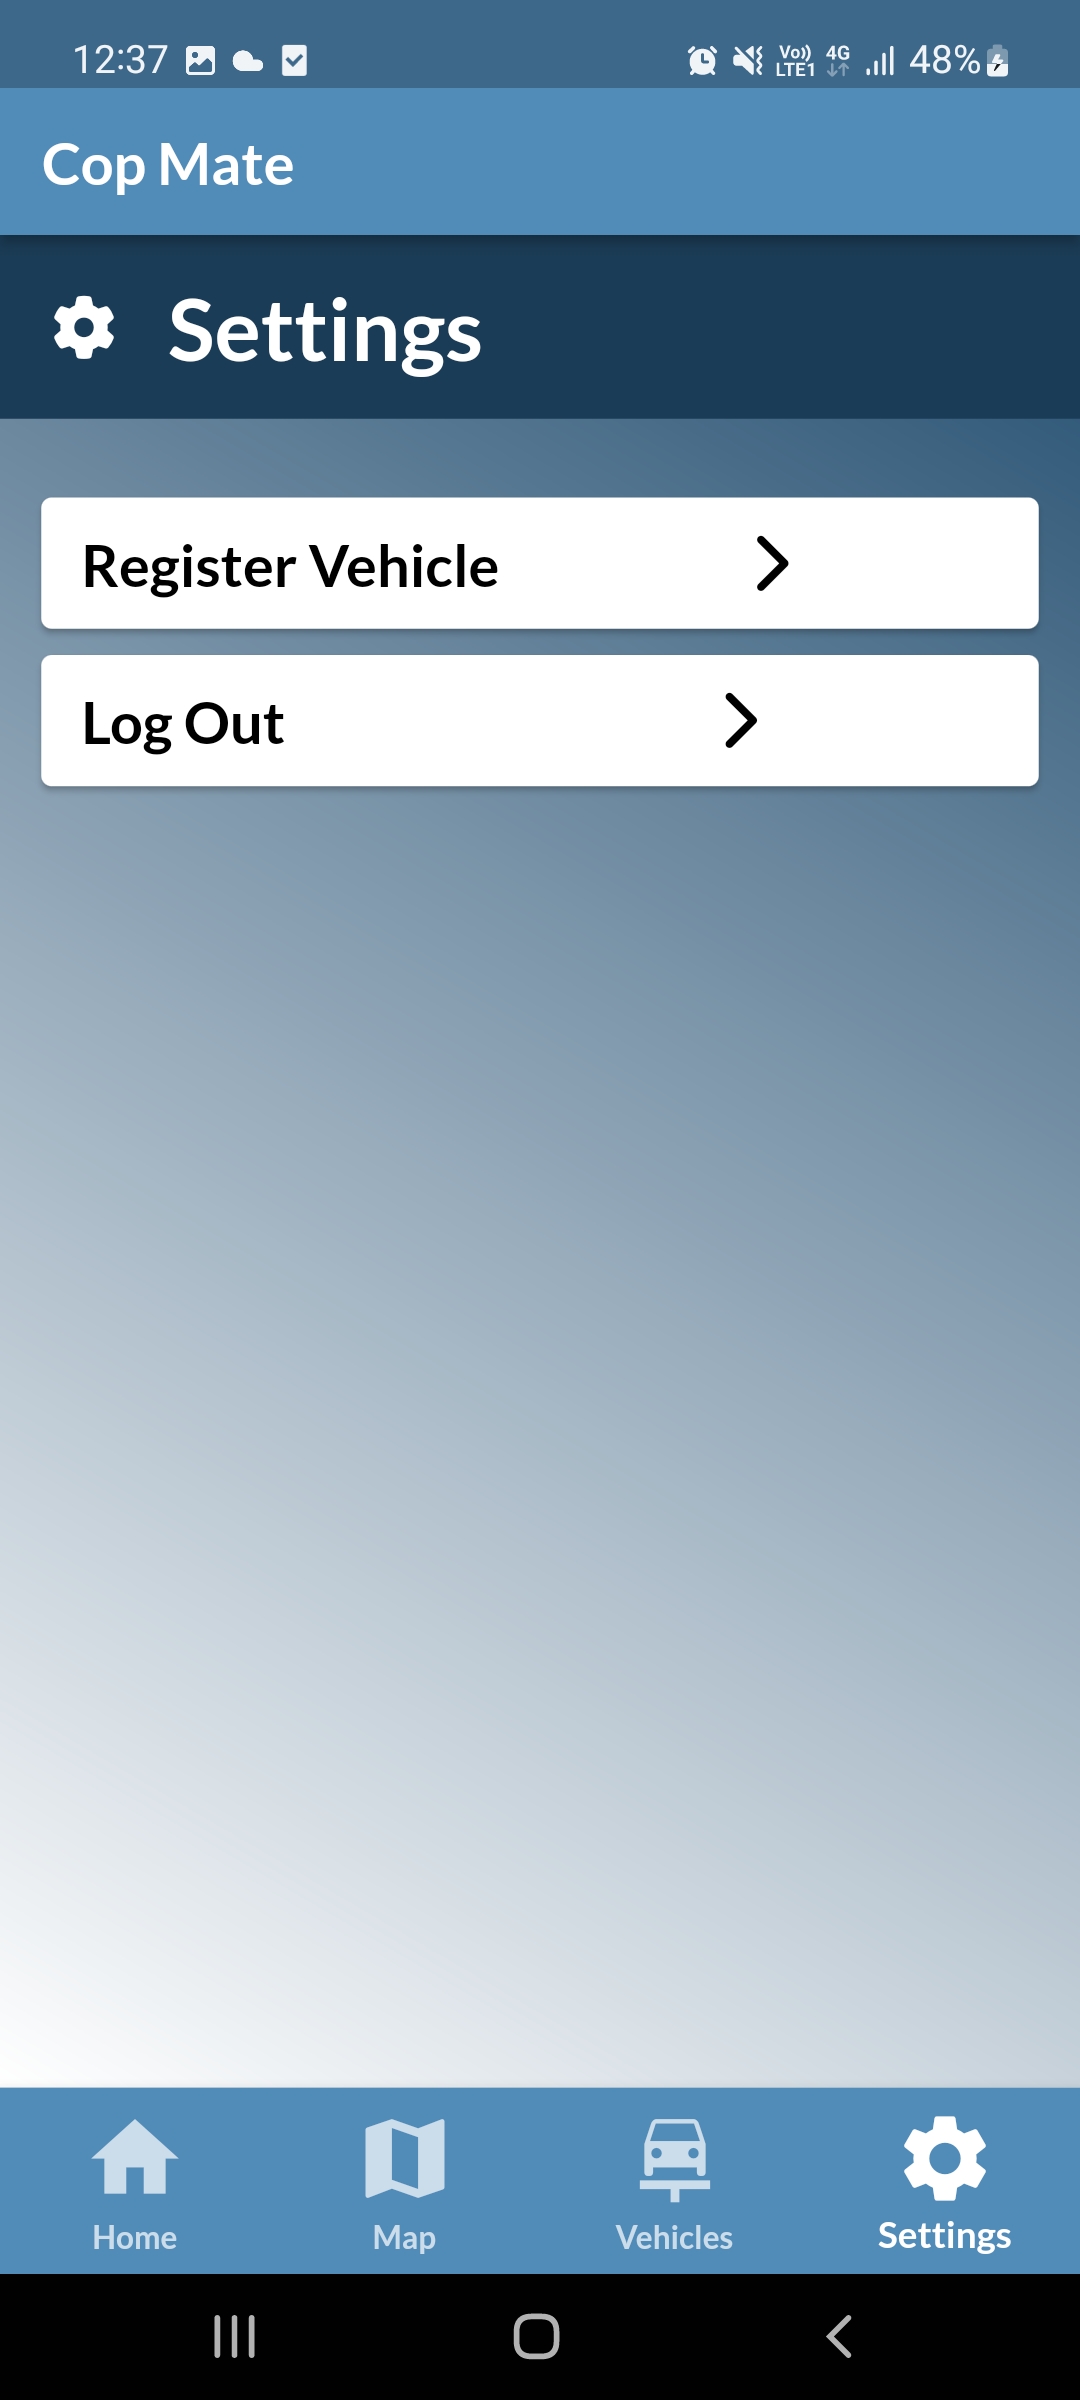
Settings
View Settings page
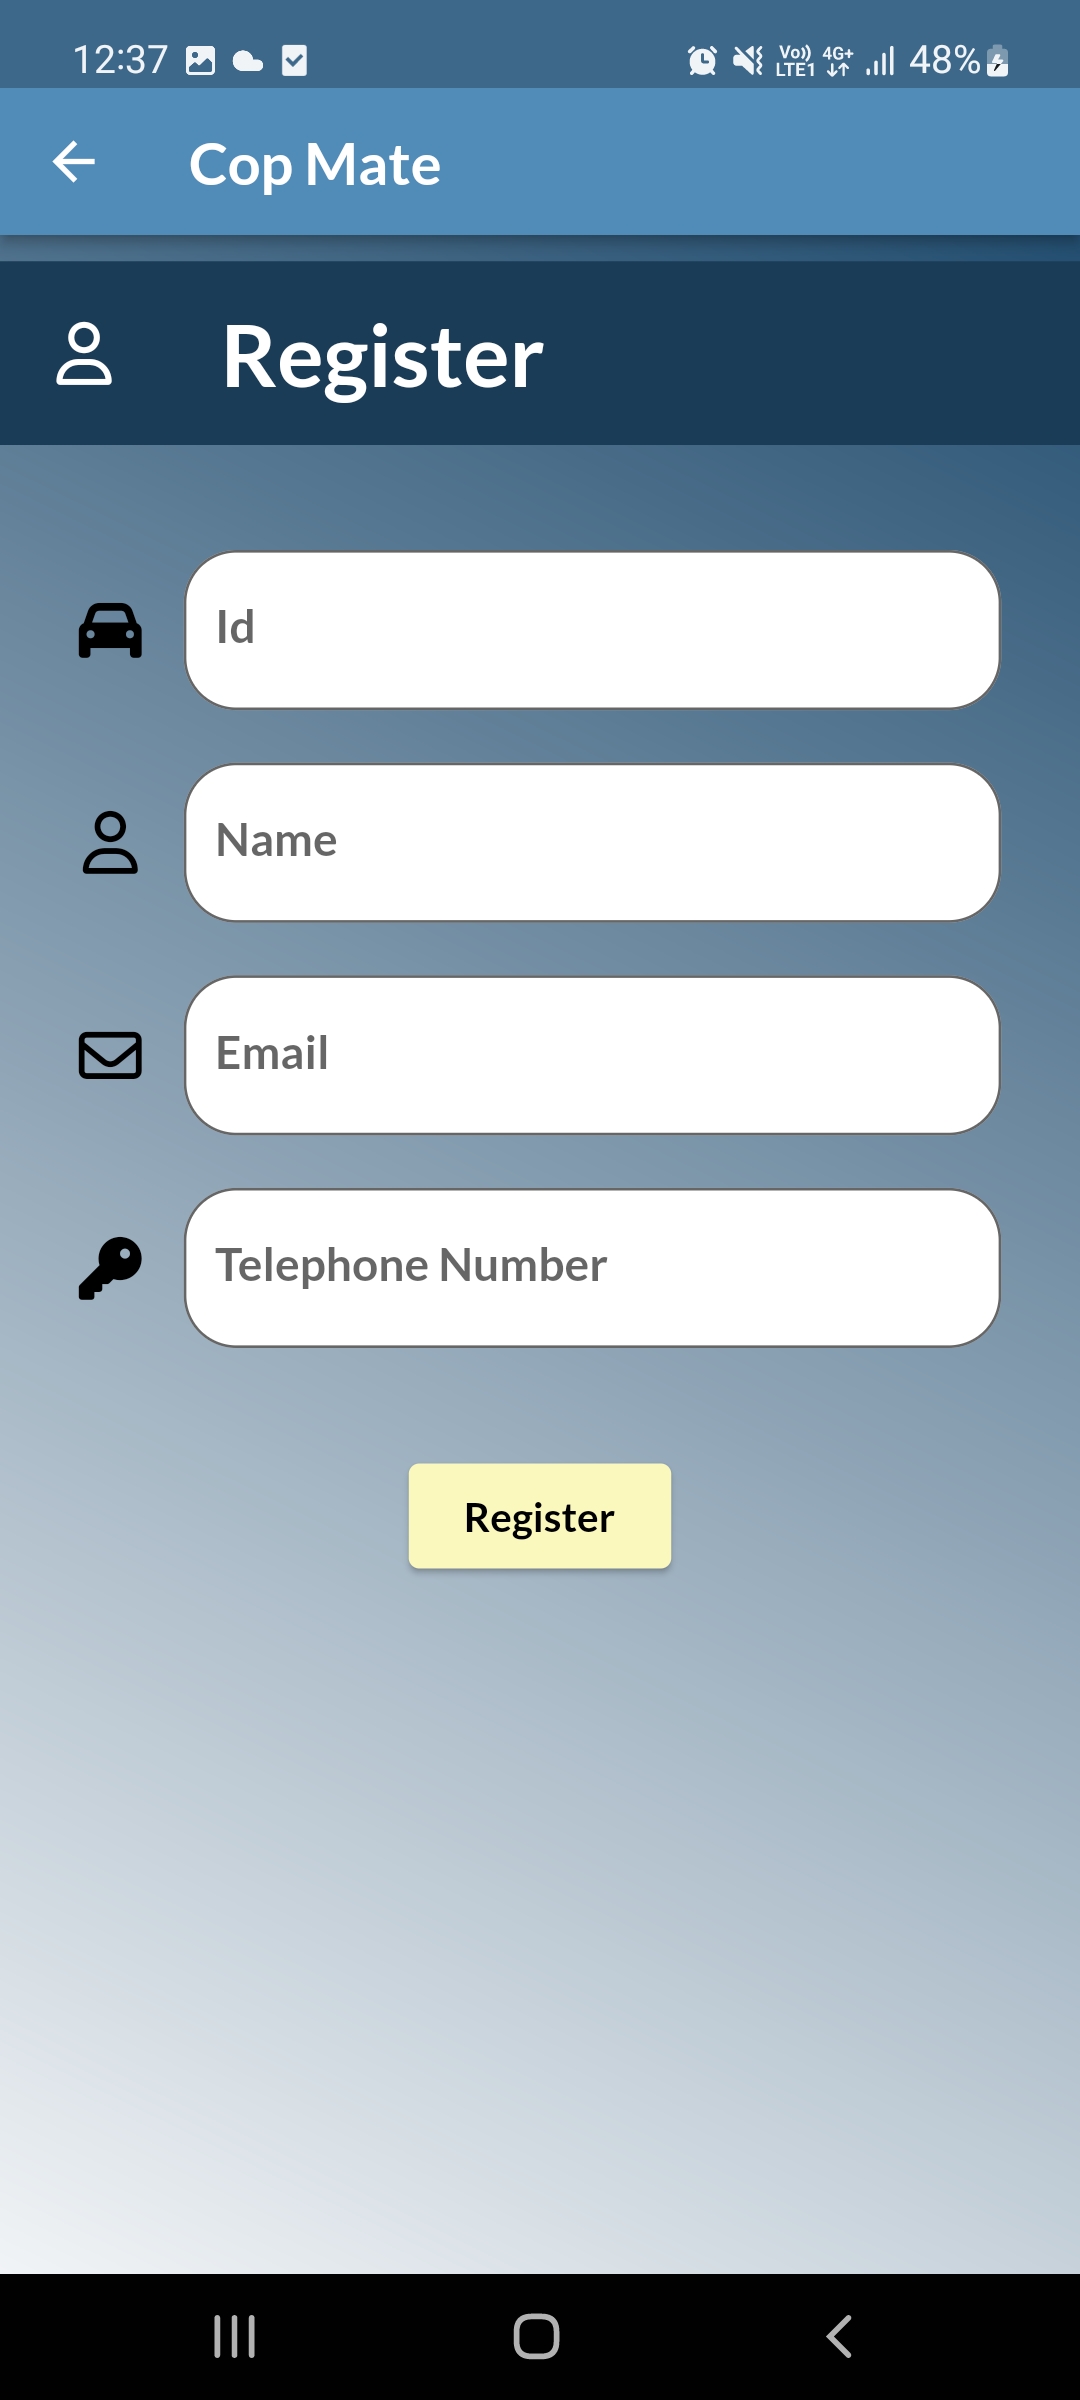
Register a vehicle
Register a vehicle
Mobile Application
Hardware Demonstration
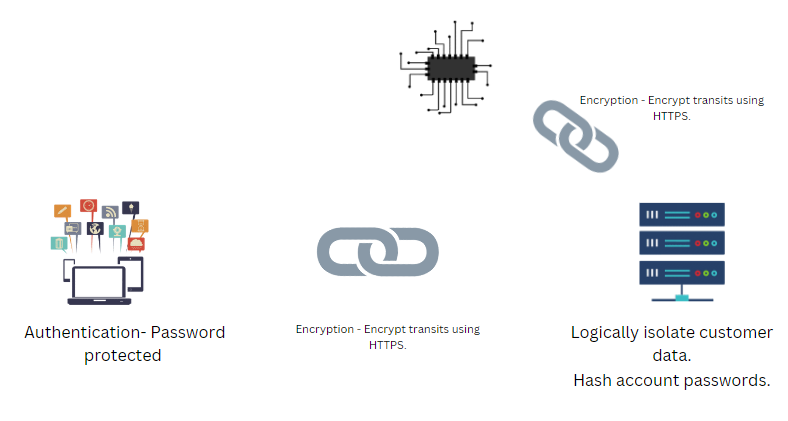
Security aspects
Encrypt the data between each node using HTTPS for confidentiality.
Hash account passwords for integrity.
Authentication at the login for privacy of the drivers and their data.
Databse access constraints. Only the admin of the database can edit and view the database and its contents.
Testing
Frontend Testing
Widget testing provided by flutter testing can be used to test individual components of the software system.
Integration testing can be used to test how the app works as a whole and how all parts work together.
Backend testing
Firebase in built authentication is used for test Authentication.
Query testing was done using postman.
Hardware testing
Mounted the device created on to the vehicle by the side of the driver's side mirror and cross lines and see the output of the code executing on the raspberry pi desktop python IDE.
Budget
| # | Component | Quantity | Price(LKR) |
|---|---|---|---|
| 1 | Raspberry Pi 4 model B | 1 | 26,000 |
| 2 | Raspberry Pi camera module V2 | 1 | 8,000 |
| 3 | SIM900A GSM module | 1 | 2,300 |
| 4 | Neo-6M GPS module | 1 | 1,850 |
| 5 | Battery 1800mah | 2 | 1,720 |
| 6 | Car power adapter | 1 | 1,090 |
| 7 | Battery Charging module TP4056 | 1 | 190 |
| 8 | Battery holder | 1 | 155 |
| 9 | Ultrasonic sensor (HC-SR04) | 1 | 350 |
| 10 | LM2596 DC-DC Buck Converter | 1 | 320 |
| 11 | Jumper wires | 2 | 700 |
| 12 | TTL converter | 1 | 470 |
| 13 | Packaging | 1 | 1900 |
| 45,045 |
Team
Jameel S.
E/18/147Team Member
Nimnadi J. A. S.
E/18/242Team Member

Wanduragala T. D. B.
E/18/379Team Member
Supervisors

Dr. Isuru Nawinne
isurunawinne@eng.pdn.ac.lkSenior Lecturer

Dr. Mahanama Wickramasinghe
mahanamaw@eng.pdn.ac.lkSenior Lecturer
Contact
Get in touch!
Location:
Faculty of Engineering, University of Peradeniya
Email:
e18147@eng.pdn.ac.lk
e18242@eng.pdn.ac.lk
e18379@eng.pdn.ac.lk