Molding Machine Dashboard
Team
Table of Contents
Introduction
This project is about building a molding machine dashboard to graphically view the information in summary of the machines in a factory.
Problem Overview
The injection molding manufacturing process is used for producing parts by injecting molten material into a mold.In our specific use case, we focus on plastic injection molding.One of the common problems in this process is when plastic residue gets stuck or left behind in the mold.Thus leading to damages to the mold , defects in products and ultimately resulting in unwanted business costs.
Existing System
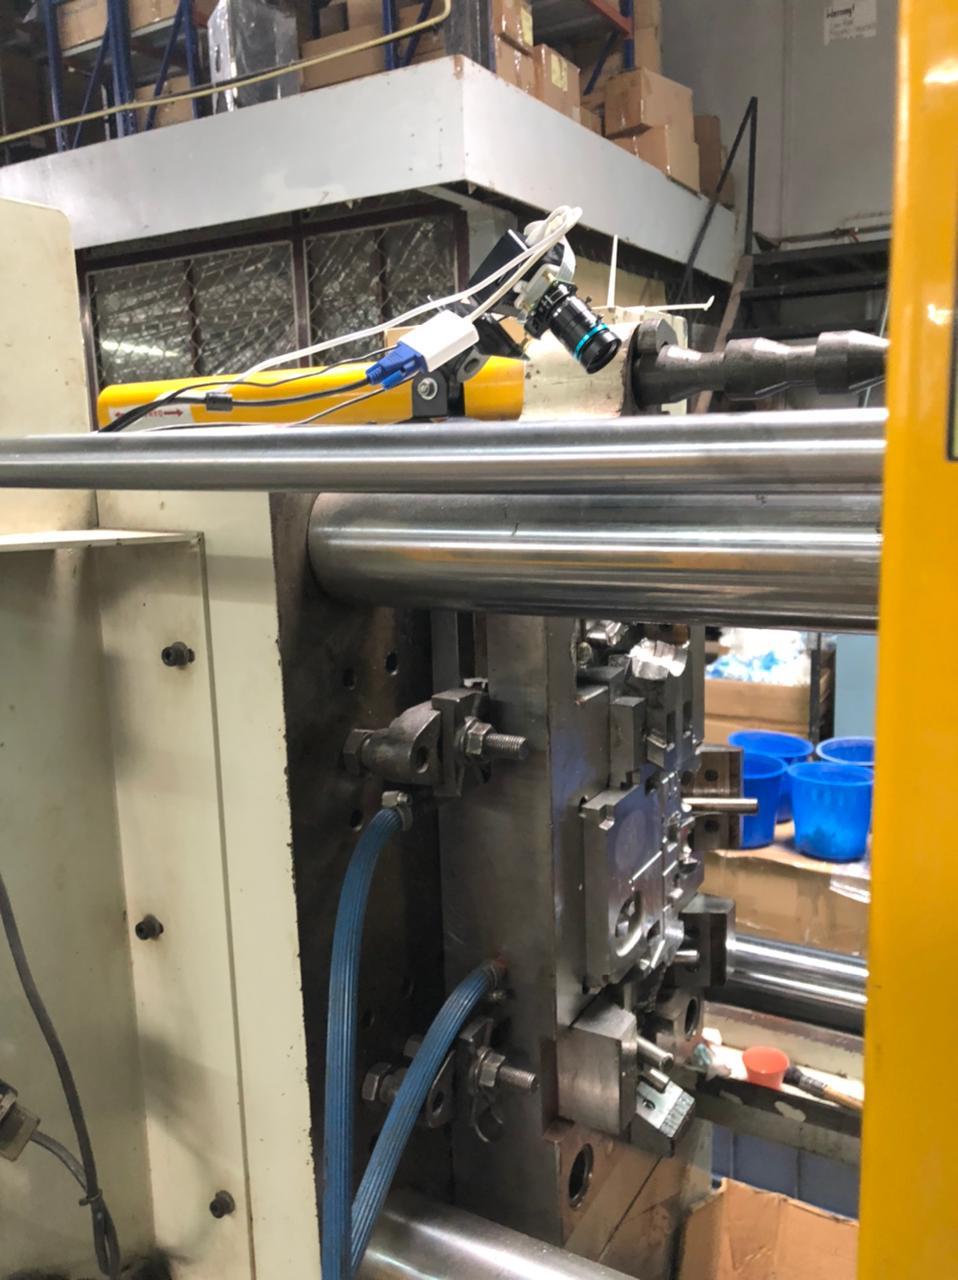
The above issue is mainly handled by checking the molds manually on each iteration. This has become a heavy burden as it costs time and money to supply this labor at a high frequency. These machines are highly capable of working on full automatic but this issue has caused a significant overhead in the manufacturing process.As a solution, a device was built to capture images of the mold in near IR frequency to check for stuck particles. Currently, this is being implemented to mitigate this issue.The implementation is purely run to check for defects using an image processing algorithm with a given set of parameters.The problem here is that although this implementation has proven to be a better alternative there is a limitation at which how effective or how true the results from this device is Currently, the built device only gives out a binary output as positive a negative. Since there is a limitation for the flexibility of the used algorithm is these results do not always turn out to be true. Hence our focus is to elevate the performance of the implemented device to produce better results.
A tool is created to represent statistical data that can be used to show the effectiveness of the algorithm. It can change parameters such as threshold values for identifying particle sizes. The images captured from the device and manually labeled image sets are used to achieve the objective. With the tool, we user has better confirmation of the errors/defects with higher assurance. It minimizes the cost of labor as the frequency of mold checks/ cleaning gets minimized and increases the overall output of the machines. The minimal maintenance cost will be significantly lower than the high price to be paid for damaged molds. With the added improvements to the device, the operation ultimately works at its maximum rated speed without interference. The Analysis Tool is built to get statistical data of the implemented algorithm. The tool automatically sets threshold values for given datasets and outputs statistical data. The current implementation is written with python using modules for file reading and system access.
View more about the existing tool from here.
Proposed Solution
As the next section of the solving the problem, a dashboard to centrally view all the statistical data pertaining to different machines will be created. It will help to improve the overall productivity in many ways,
- Provides a central view of data
- Easy of management
- Saves time and resources
- Improves decision making
- Up-to-date progress evaluation
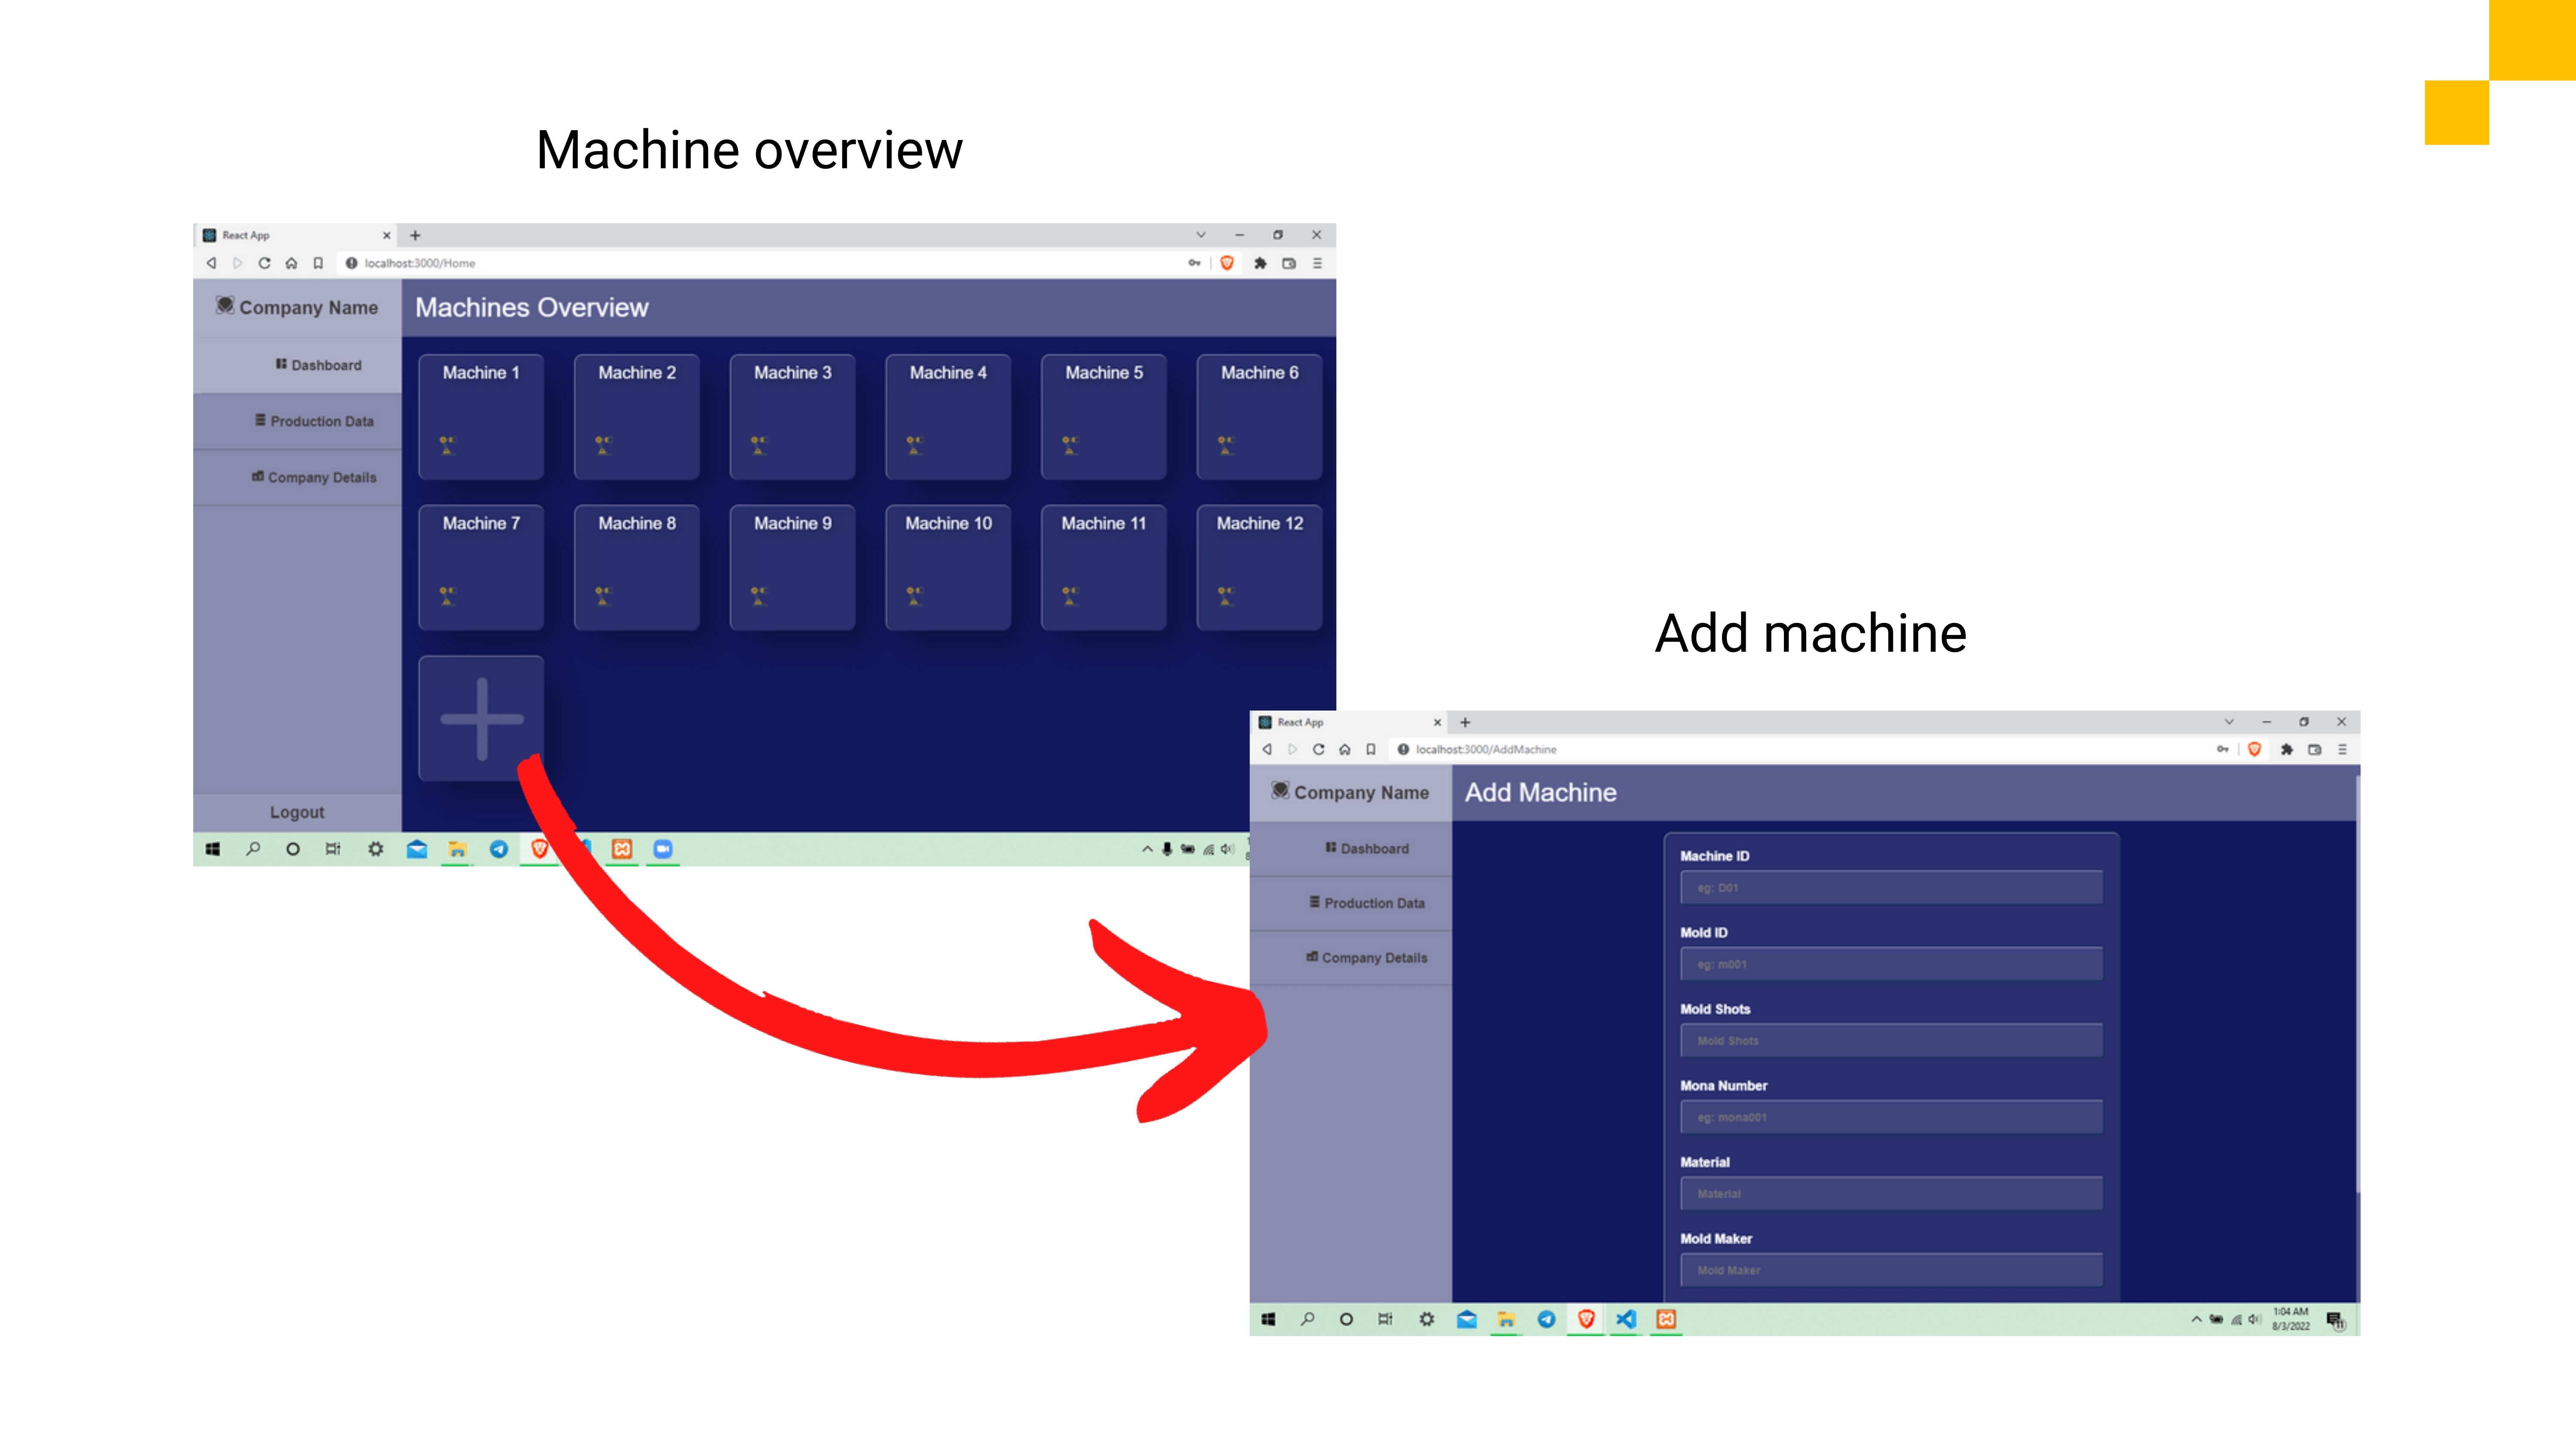
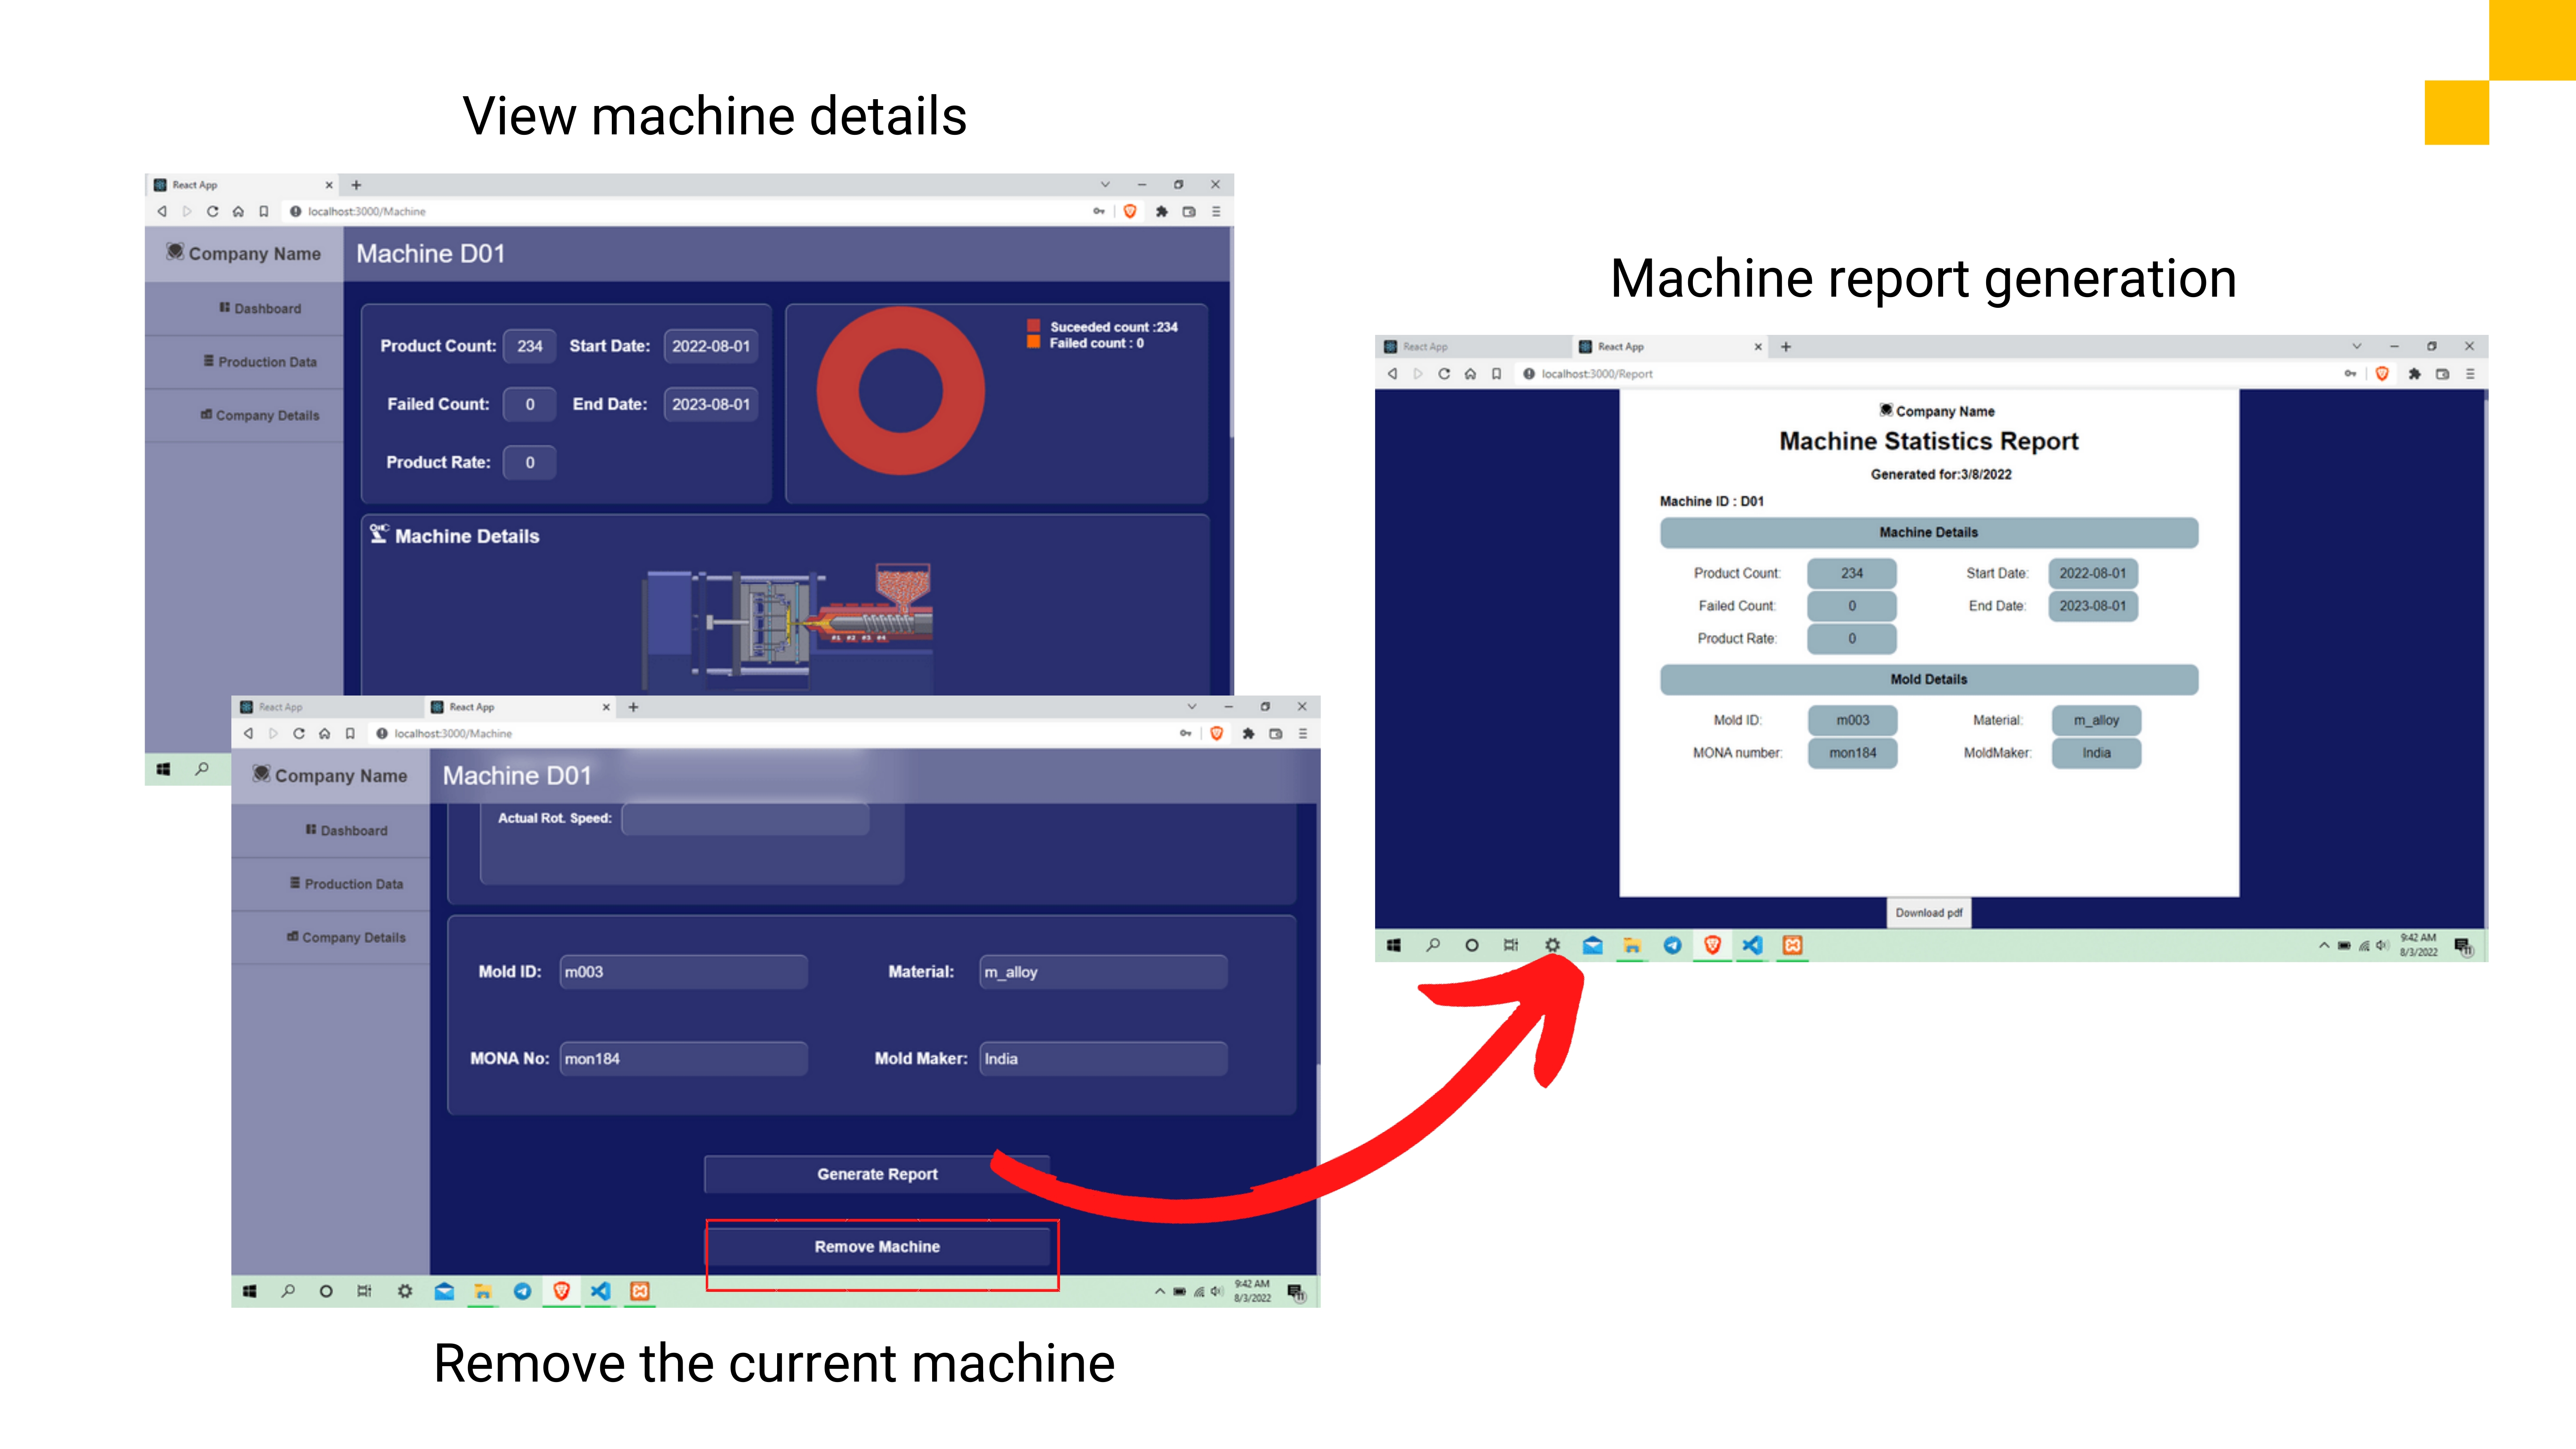
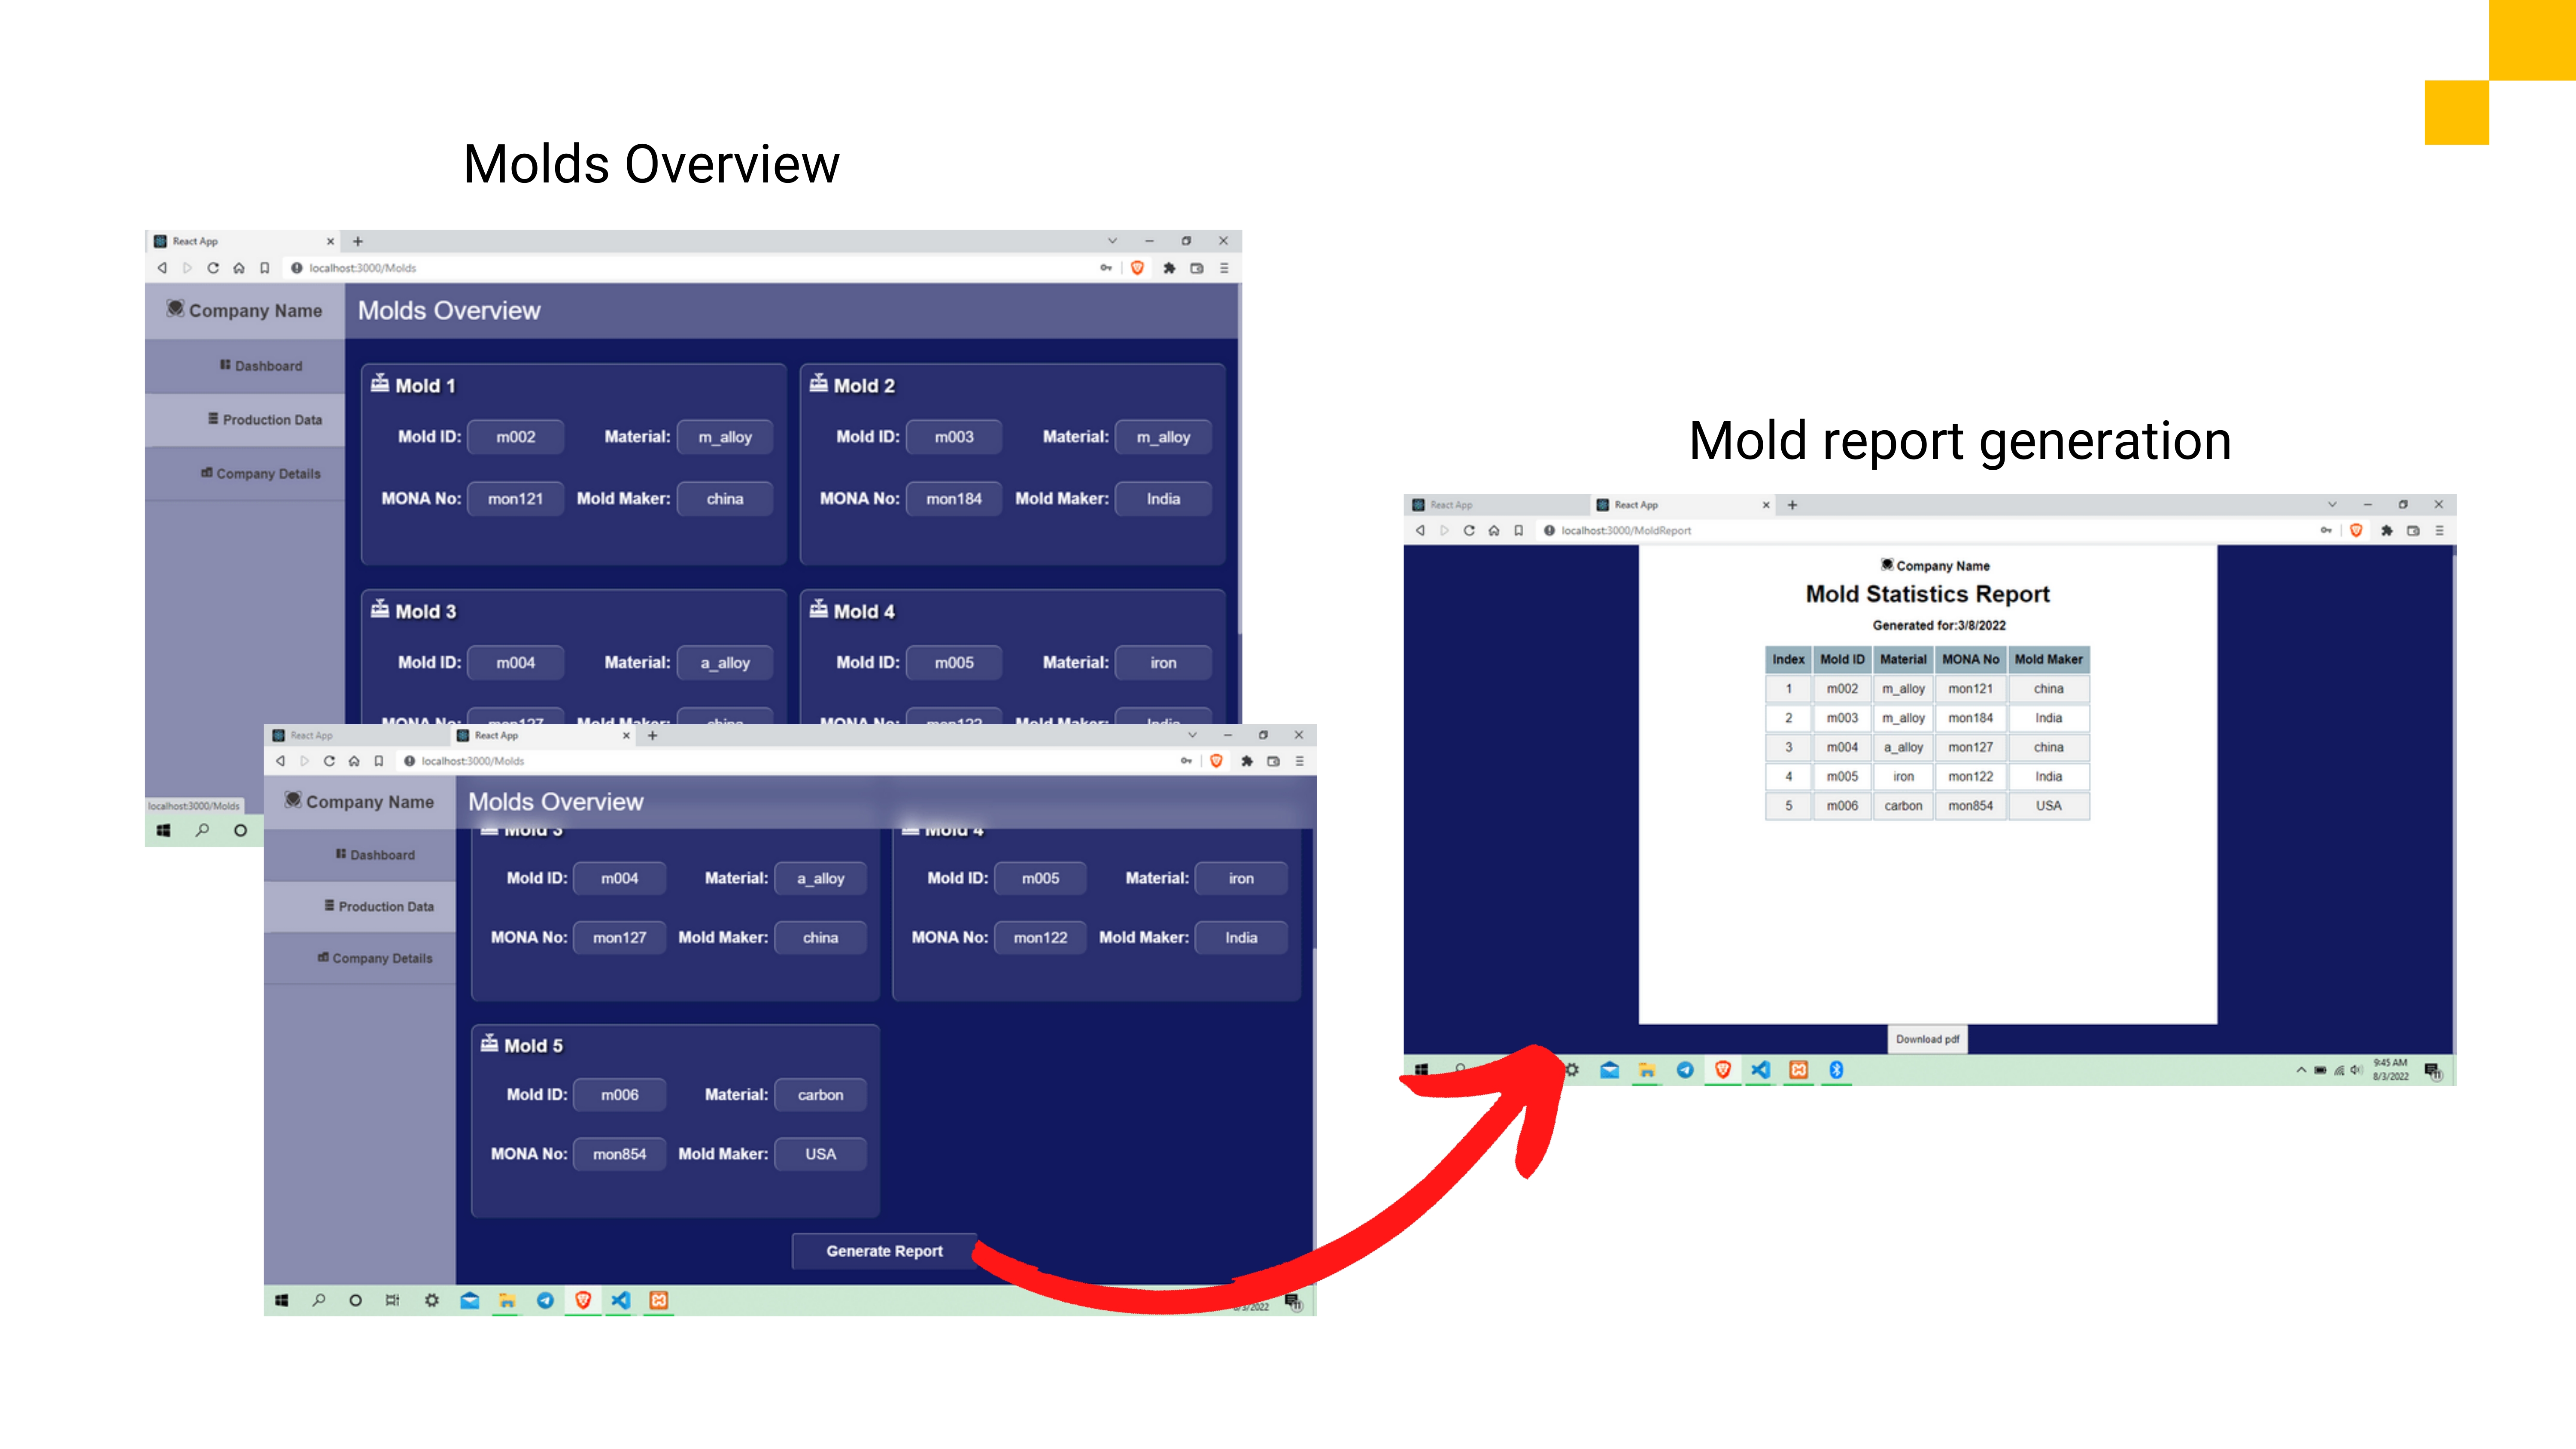
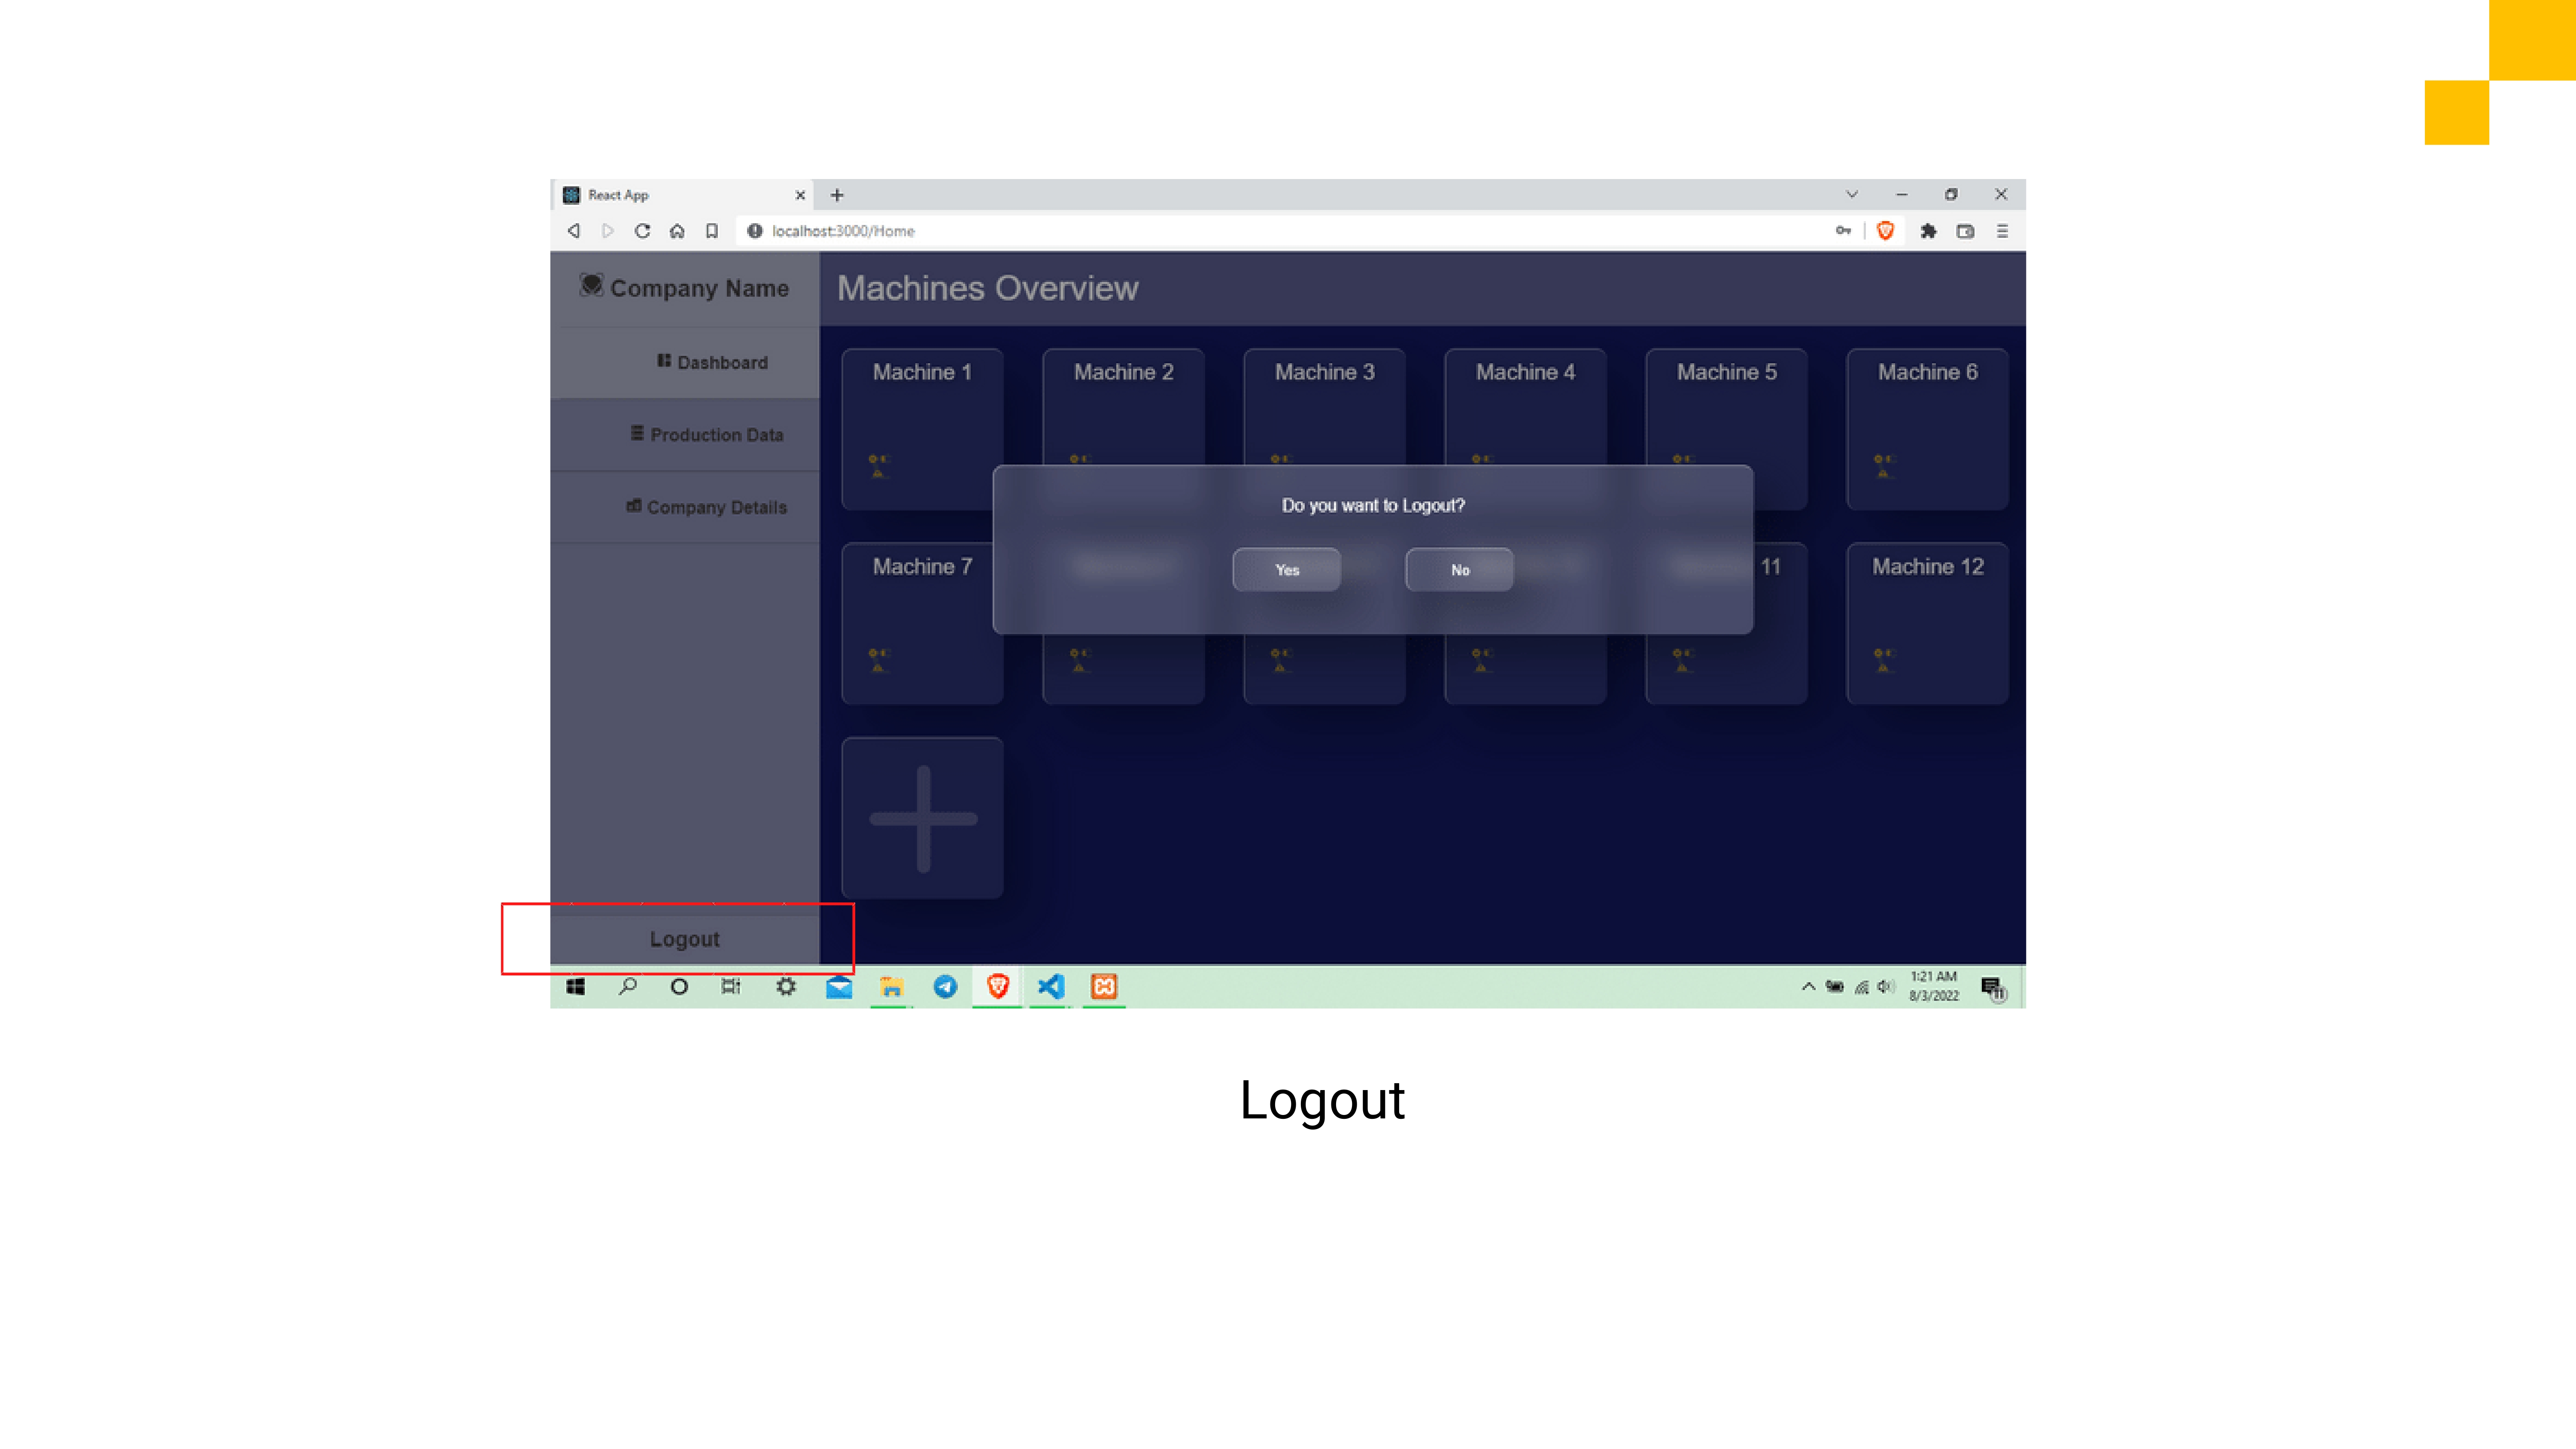
The Dashboard will have several key interfaces; an overview page of all the machines that listed all the machines as cards, statistical data view page for each machine which contains graphs and numeric data that shows identified defects, mold information that are used in the machines.
Some features of the dashboard

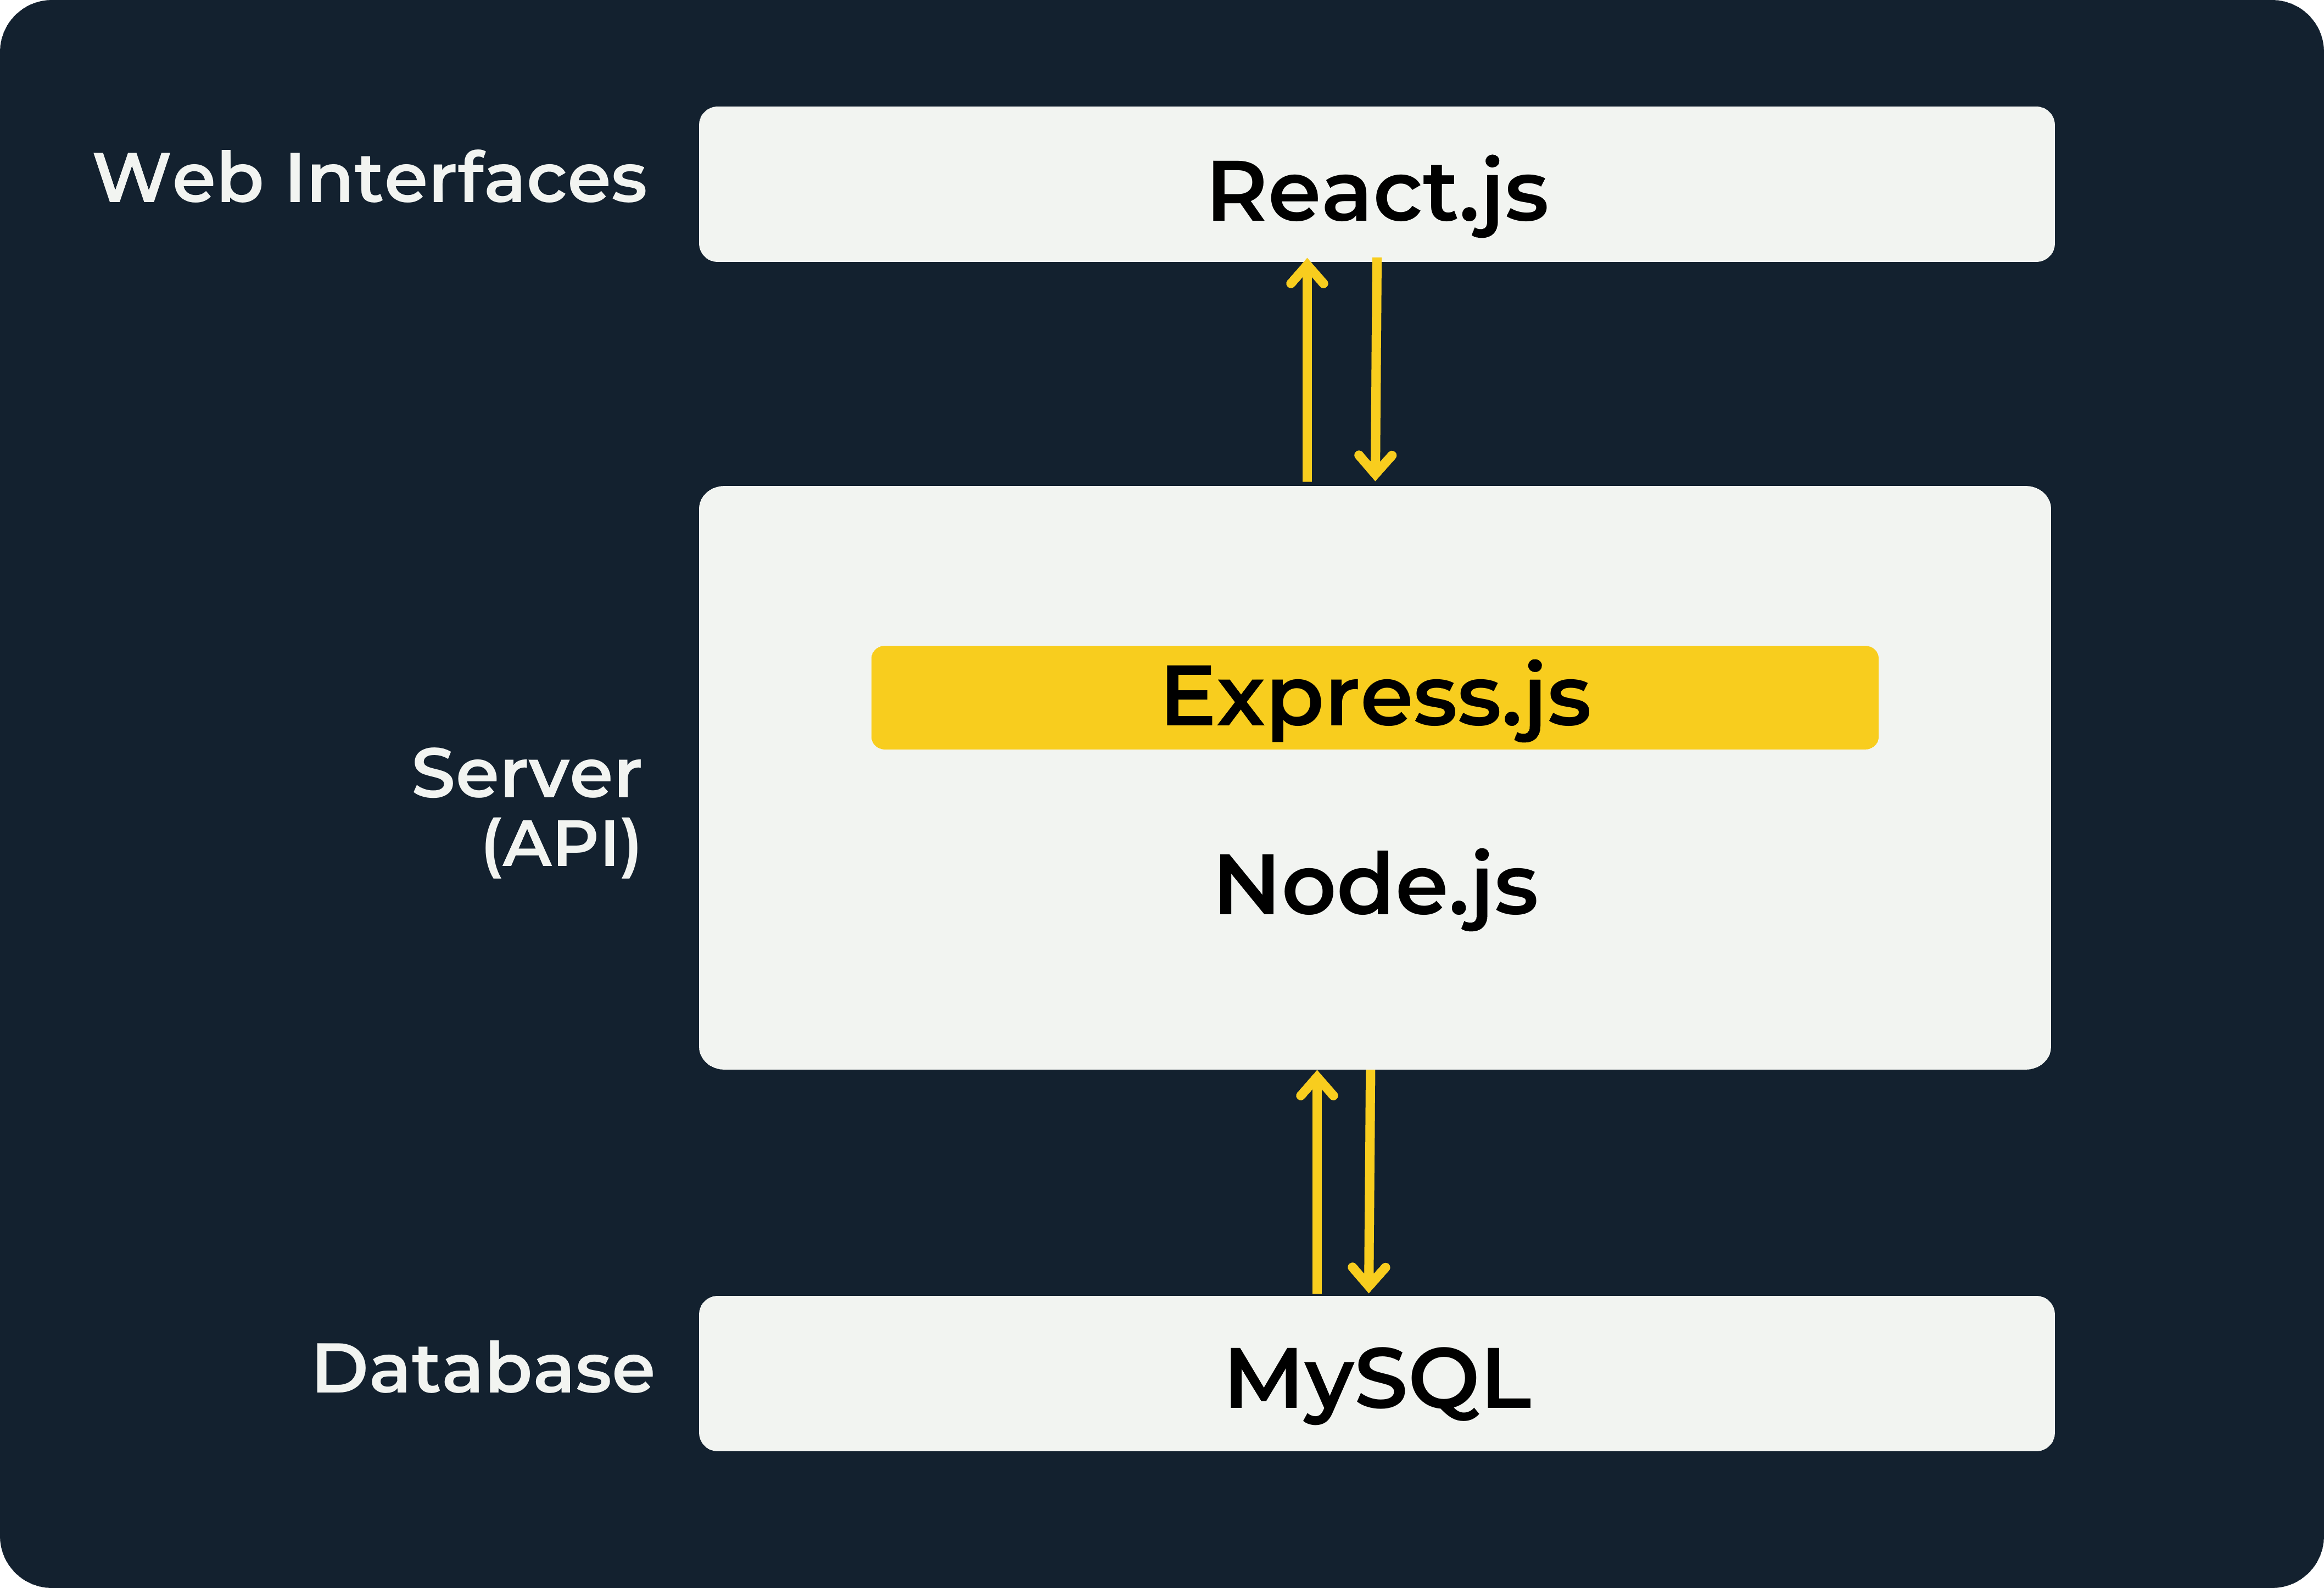
Technology Stack
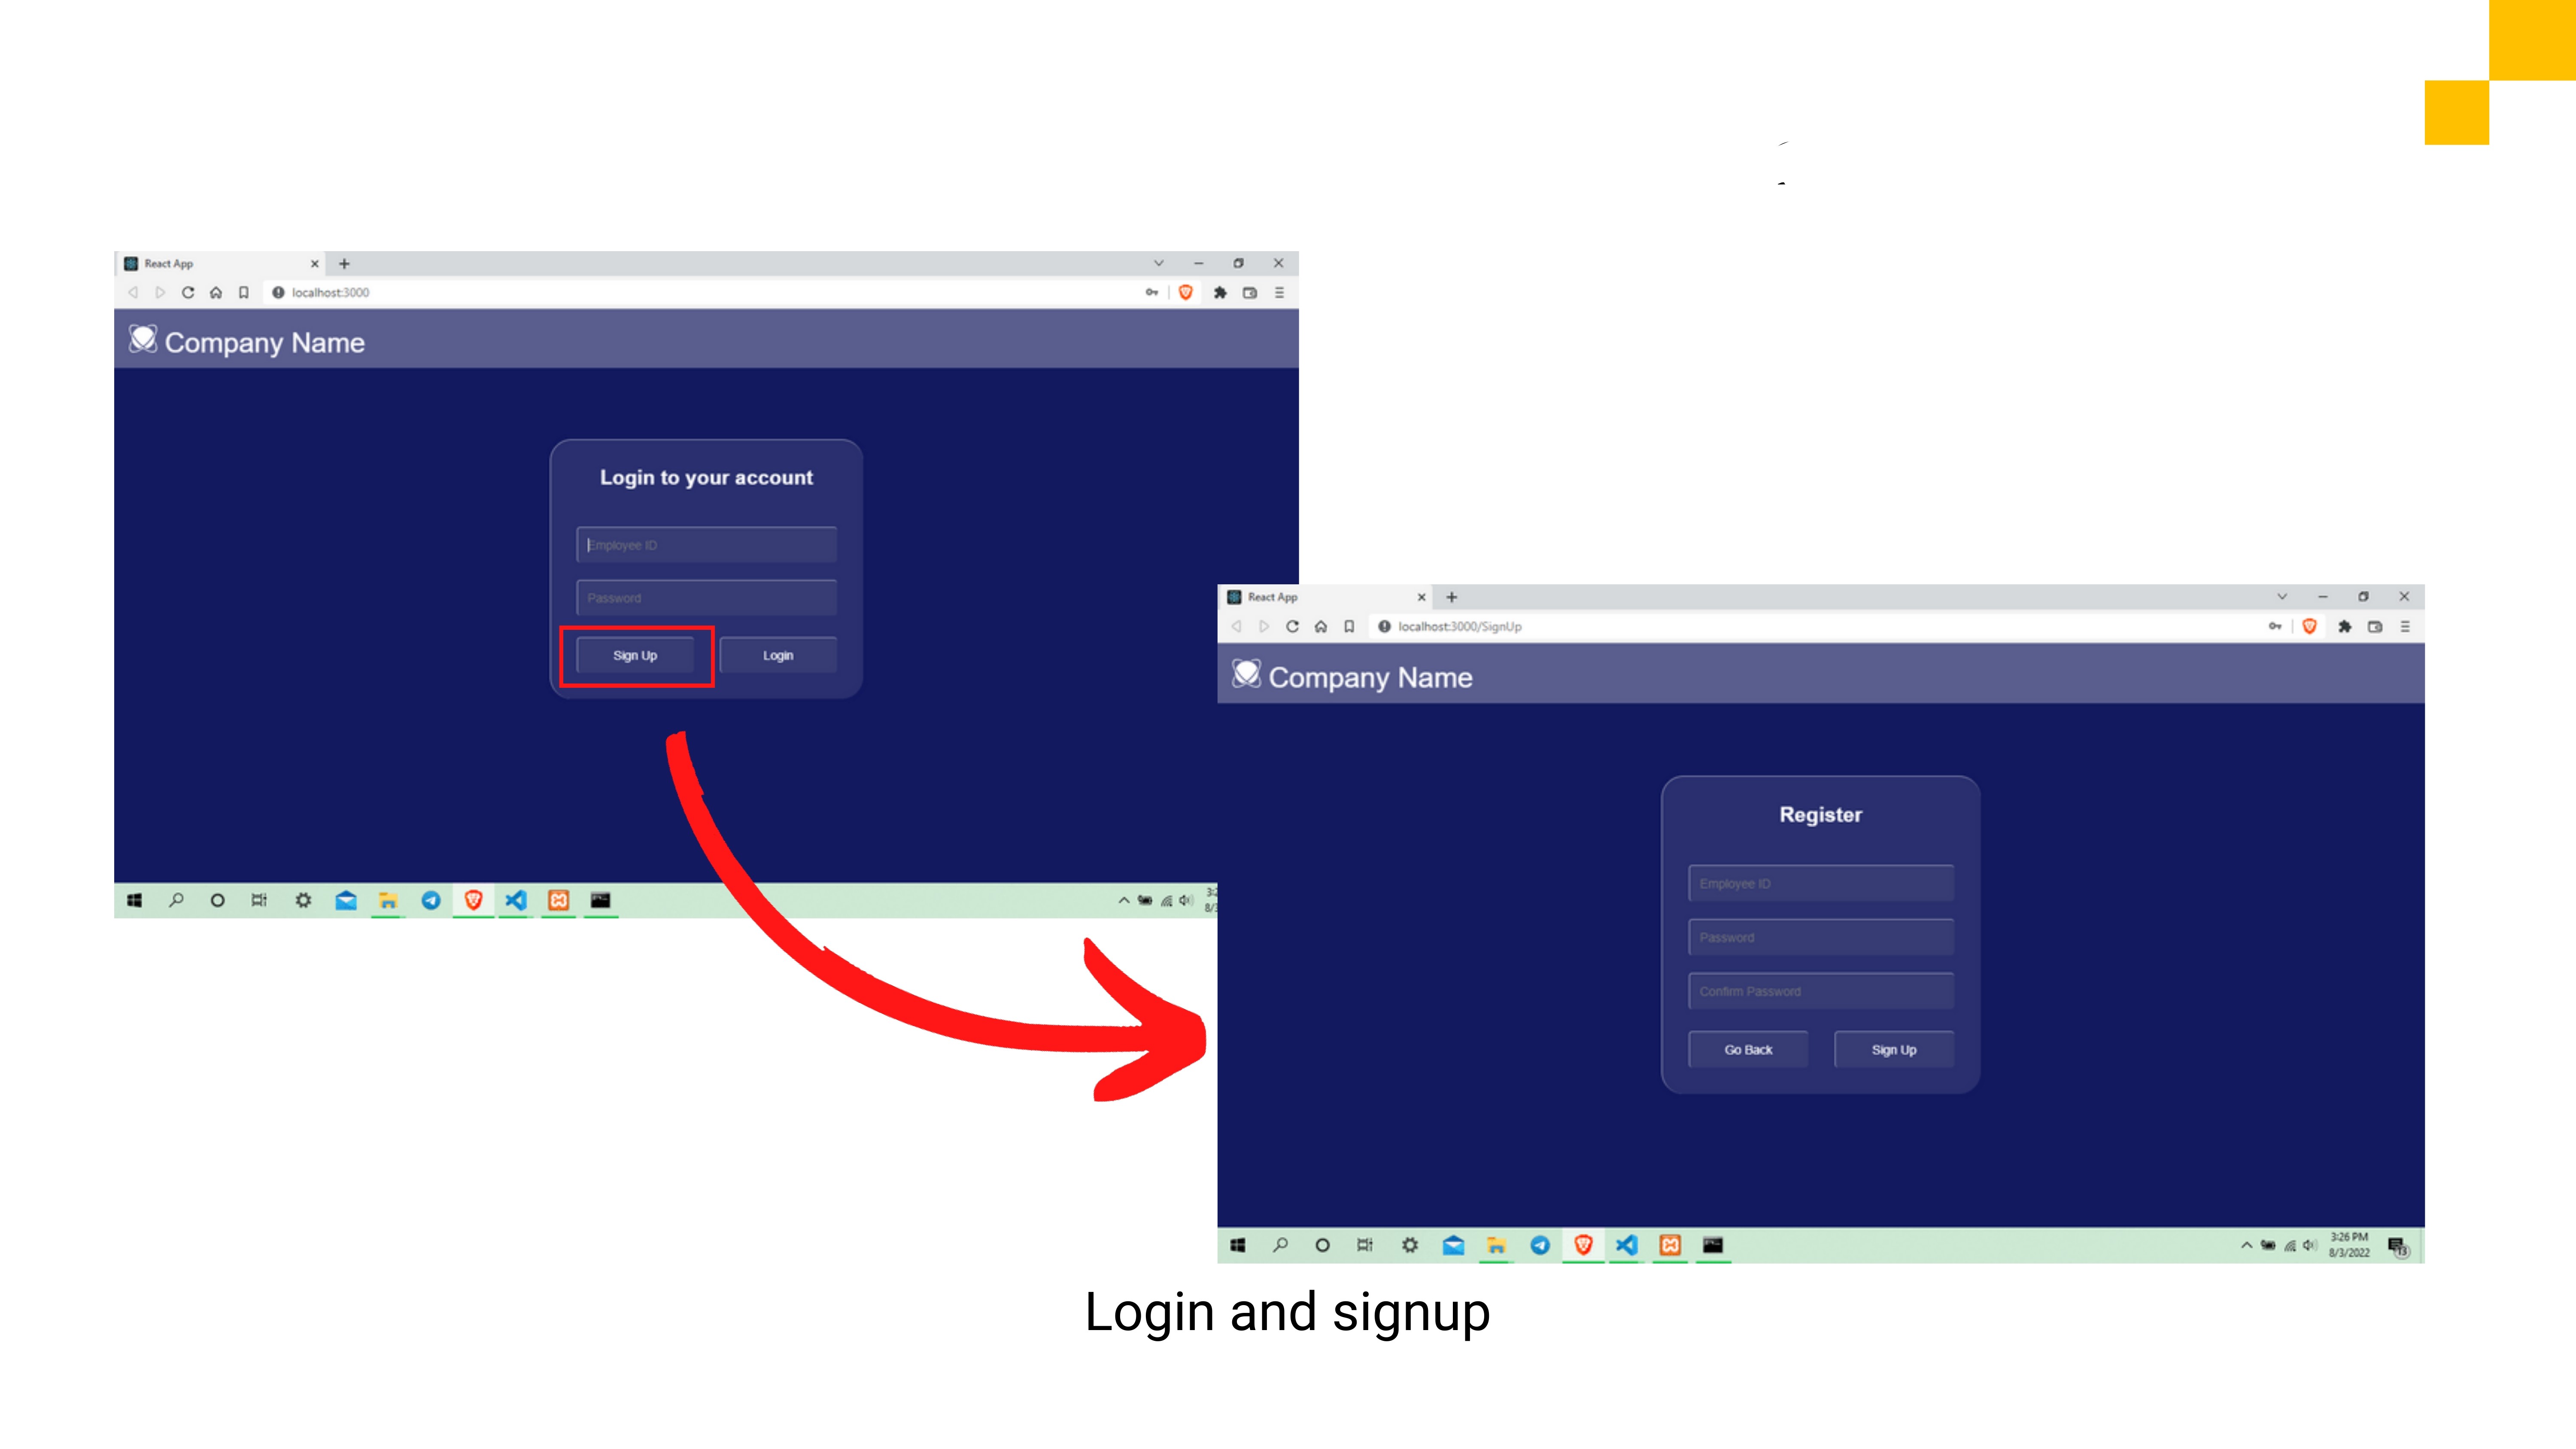
User Interfaces